
Parks Can Reduce Urban Heat Island
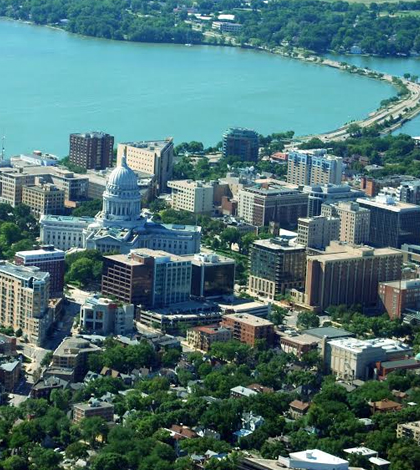
Aerial photo of Madison, Wisc. shows urban vegetation is an integral part of the city. (Credit: Sam Zipper)
City features such as building walls and roofs, along with street surfaces, add up to a lot of areas that hold the sun’s heat. As a result, city centers are significantly warmer than rural areas.
The added warmth can mean changes in vegetation located inside cities, as in gardens and parks. Higher temperatures can mean earlier greening or longer growing seasons, which in turn affects animals and whole city ecosystems. The advanced greening can throw off the timing of flowers’ blooming, for example, which can impact insects and birds.
As Sam Zipper, a postdoctoral research associate in the Department of Civil Engineering at University of Wisconsin — Madison, has found, the effects of elevated urban temperatures on city ecosystems vary depending on the distribution of greenspace within a city.
Zipper and a team from the university have one of the densest urban temperature monitoring networks in the world, a total of 151 sensors spaced at 4 square kilometers per sensor around Madison, Wisc. Using the data-gathering system, Zipper and colleagues have measured the temperature and relative humidity of the city’s spaces in great detail.
“We found a lot of variability in the temperature distributions over the cityscape depending on the size, shape and location of the green spaces,” says Zipper.
The sensor network uses HOBO U23 Pro v2 sensors to measure temperature and relative humidity. They take measurements every 15 minutes, giving 96 data points per day, or about 35,000 data points per year per sensor. The sensors are mounted inside radiation shields and sit on telephone or utility poles at heights of 12 feet above the ground.

Jason Schatz installs a temperature sensor (housed in a radiation shield) on a pole in an urban park. (Credit: Sam Zipper)
Researchers gather data from each sensor twice a year, in spring and fall, using an optical connection which links directly to a computer. The sensors are mostly deployed in the city but there are some positioned outside of its limits for comparison.
In a recent study, data from the sensor network were compared to 110 satellite images from Landsat, a U.S. Geological Survey satellite. The high-resolution images, depicting 30-by-30 meters of land each, covered a period from 2003-2013.
“We were looking at what the satellite images told us about growing seasons, about greening and browning of the vegetation and when it occurred, versus what the sensor data told us,” says Zipper.
Data were processed via the Center for High Throughput Computing at the university, which is part of the national Open Science Grid. Thousands of academic researchers participate in the computing network.
Zipper and his team used the R programming language in their work. They processed satellite images by “stacking” different years’ images together to get a sort of “average” year.
“The satellite images weren’t taken every day, more like every 16 days. But if you stack them by year you can get some data for most days and a picture of what an ‘average’ year is like emerges,” says Zipper. “We also used our algorithm to eliminate atmospheric effects that we didn’t want in the images.” If an image wasn’t of good enough quality, it was thrown out.
The satellite images confirmed that greening in urban spaces happens rapidly. But they also revealed a few surprises when compared with the sensor data.
“We did find that what the sensors told us about the greening process did not necessarily match what we saw in the satellite data. The sensors seemed to give us the potential growing season, whereas the satellite images gave us the actual growing season,” says Zipper. “The reasons behind that were complex, but one of the reasons was that certain vegetation types will green faster than others. A green space that was primarily grass, for example, always seemed to green up earlier than one that had a lot of tree cover.”

In this photo from April 2016, differences in timing of spring green-up between grass and trees are apparent. (Credit: Sam Zipper)
Turf grass was found to be less sensitive to temperature than other species. But each species seemed to have its own way of responding to temperature. The greening tendencies of different species means it could be difficult to separate an urban heat island effect from a land-cover type of effect.
Differences in images the team saw could have been capturing tree- and grass-cover differences instead of urban heat island effects. Images showed that areas with a lot of turf had longer growing seasons than areas that were mainly trees. But sensor data showed that park areas were cooler than other areas of the city.
Being in an urban heat island affected vegetation in many ways. “On average, the growing season can start earlier, because the urban surfaces hold heat in and that encourages early growth,” says Zipper. “It can also lengthen the growing season.”
With that, the concern is that insects, birds and other animals whose livelihoods depend on blossoming urban vegetation might have different biological clocks that don’t sync up well with that of the accelerated urban landscape, meaning they might emerge at a less than optimal time. For example, greening may have already occurred and food production may have already peaked by the time bees and butterflies appear.
As Zipper has found, however, urban parks can definitely mitigate the heat island effect of urban areas. “Every little bit of greenness counts,” Zipper explains. “Even a park that’s only one square block can help.”
The parks do a lot to mitigate the heat effects from cities because they cool areas nearby and that helps to reduce effects that might make the timing of blossoms and other ecological processes accelerate because of urban heat island influences. Zipper and others are still figuring out what should be in the parks to make cooling most effective, as well as considering their shapes, sizes and the species they contain.
What is planted in the park also depends on the overall goals of the city. In Madison, urban heat island effects vary greatly, depending on the exact location in the city and the amount of green space.

Sam Zipper installs a temperature sensor (housed in a radiation shield) on a utility pole. (Credit: Jason Schatz)
“In Madison’s city center, our temperature sensors showed us that greening was occurring about a week earlier than in parts of the city where a park was providing cooling,” Zipper explains. “We have coverage of all different land types with our sensor network, so we can see the whole range of effects.”
Madison is located on a narrow strip of land between two natural lakes. The lakes dominate the landscape, which is full of native oak savannah. Combining that with the city and its parks no doubt contributes to the variety in temperature measurements researchers saw.
Summarizing the results of the study, Zipper says, “We saw strong growing response to urban effects, no matter what the weather was. In 2012, we had record-breaking heat and in 2013 we had a record-cold winter. We saw the urban heat island effects on the growing season of the vegetation in both years. So it is likely those effects would be consistent despite weather variations over the years.”
Generally, Zipper wants to convey the message that green space is critical for curbing the effects of urban heat islands.
“Every little bit of green space is important,” he says. “We need to think carefully, as populations grow, about how to manage city expansion without removing too much green space to mitigate temperature effects well. It’s much easier to go from a green space to a building than from a building back to a green space.”
In the future, Zipper and his colleagues would like to assess what such variability in the urban environment does to water requirements.
“What effects do the urban heat island’s accelerated growing season have on the water supply?” says Zipper. “How severe are the effects? These are things we’d like to find out.”
The study into the urban heat island effect is part of a larger project funded by the National Science Foundation looking at the future of the Yahara Watershed, which contains Madison, through 2070.
Top image: Aerial photo of Madison, Wisc. shows urban vegetation is an integral part of the city. (Credit: Sam Zipper)
One Comment
Leave a Reply


Pingback: 50 ways parks and recreation pay out everyday! – Dig It!