Airborne Observatory Charts California Drought Effects
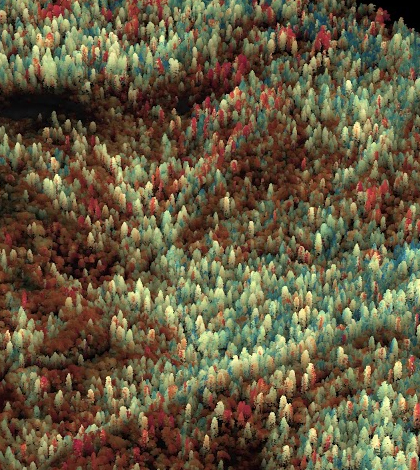
Spectroscopic image of canopy water content, California. (Credit: Greg Asner)
California relies on its trees for carbon storage, timber, tourism and recreation. The trees are critical to California and its ecosystems. But years of drought have killed or damaged large numbers of trees covering an area of about 41,000 square miles.
Determining the extent of the damage, as well as plans for mitigation, requires a great deal of specialized equipment, detailed knowledge and extensive research. Greg Asner, forest ecologist at the Carnegie Institution for Science, along with his team, has managed to develop and deploy the technology necessary for assessing California drought effects on millions of the state’s trees over multiple years.
“We built the first Carnegie Air Observatory (CAO) in 2007 and we’re currently on version three, which we made in 2015. It has an imaging spectrometer on it that measures chemicals in trees as we fly over them. We could measure quite a few chemicals, but in the current study we just focused on water,” Asner says. “The spectrometer is laser guided and it identifies each tree separately in three dimensions. It measures the mass of water in grams or it can do volume of water in the foliage of each canopy.”
Asner was mainly interested in canopy water for the drought effects study, since tree trunks ultimately act like pipes, transporting water to the canopy.
“In addition to the CAO, we also have a tree climbing team that spends the summer actually up in the tree canopies to collect physical canopy samples,” Asner says. “There are 21 chemical traces we can look for in the leaves. We can look for various nutrients, chlorophyll, carotenoids, etc.”
Asner and his team capture and store leaf samples in small cryogenic storage units they take with them into the field. Using liquid nitrogen, the units stay at -70 degrees Celsius. “They are about the size of R2D2,” Asner explains. “Trash can size.”
Consisting of about 12,000 samples, the Carnegie collection is a very large repository of plant samples. “It’s actually the largest cryogenic sample repository for tropical trees in the world,” says Asner. Samples consist of entire branches of leaves. Analysis of samples occurs back at the lab in what Asner refers to as his “chemical de-assembly line.”

Spectroscopic image of canopy water content, Pinnacles National Park, California. (Credit: Greg Asner)
“Sometimes we use three locus DNA barcodes,” Asner says. “There are many pieces of data we are interested in. There’s just a huge amount of information in the samples. For example, some trees seem to be more drought resistant than other trees. DNA analysis for those would be interesting to do in the future.”
Asner also looks at non-structural carbohydrates, chemicals that indicate how well individual trees are doing over a long period of time.
Asner and his team built a large computer to deal with the enormous amount of data they collect: up to 2 terabytes per day.
To deal with all the data gathering, storage and analysis, Asner requires a 10-person team. On the team are computer experts, aircraft engineers, pilots, field people and others who conduct data analysis.
“Though the actual flight sampling trip might take 13 days, the data analysis might take 4 months,” Asner explains. “And that’s just some of the information buried in the data. It would probably take years to process all the information in the data.”
Asner and his team have been studying drought-stricken trees since 2006, after Asner founded the program. “Over the past 20 years, there have been radical changes in the technology for monitoring trees,” he says. “Huge scientific gains have been made. We now know how to chemically map any tree we fly over…we couldn’t do that years ago.”
The advances in technology are vitally important, because having the data means it is now possible for conservationists and decision makers to discover and implement what is really best for the drought-stricken region.

Spectroscopic image of canopy water content, Southern California. (Credit: Greg Asner)
“Now we know which trees are suffering the most, but are not dead, so we know to attend to those areas first,” Asner explains. “It’s very important for California communities that non-scientists make use of our data.”
In terms of the data itself, Asner has shown huge declines with lots of tree stress due to the prolonged drought for some areas, while others have shown little change. Four factors seem to be responsible for the differences: species affected, elevation (cooler temperatures seem to mitigate effects of temperature increases more than lower places that typically have warmer temperatures), topography and variability in rainfall from area to area.
Using those factors, Asner and his team hope to develop the ability to predict which forested areas will need the most attention in the future. They are also trying to get a handle on progressive water stress, which would involve chart equations to predict the depth of tree water stress.
“Our data have shown that, essentially, most California pines are in trouble,” Asner says. “The Redwoods are not doing as badly and the oaks vary by species, with some severely impacted and others showing little change.”
In terms of future monitoring technology, Asner has big plans. “We can use our current monitoring technology anywhere in the world where there are drought effects, such as Panama and Peru. We’re interested in where we can have the most management impact,” he says. He is also looking into the possibility of launching their CAO technology into space in a partnership with NASA’s Jet Propulsion Laboratory. “The plan would be to collect data every 16 days as our satellite-mounted apparatus travels in Earth’s orbit. The data would be free to anyone in the world. That would be a great thing.”
But Asner wants to emphasize the magnitude of what he has already seen with the effects of drought on California’s trees. “The sheer level of drought effects on the trees we analyzed was shocking,” he says. “It was one of the worst things I have ever seen in terms of forest vulnerability.”
The images Asner and his team took were so disturbing that they were able to get the attention of non-scientists and government officials. “Our data supported Governor Jerry Brown’s declaration of a state of emergency in California,” Asner explains. CAO data are also helping the state’s Department of Forestry and Fire Protection (CALFIRE) in its mission.
“I’m glad we were able to support the State of California,” says Asner. “I’m really excited about our technology and I’m looking forward to supporting forest conservation and management with our science in the future.”
Top image: Spectroscopic image of canopy water content, California. (Credit: Greg Asner)


0 comments