Buoy Monitoring for Red Tide, Students Watching Sea Level Rise
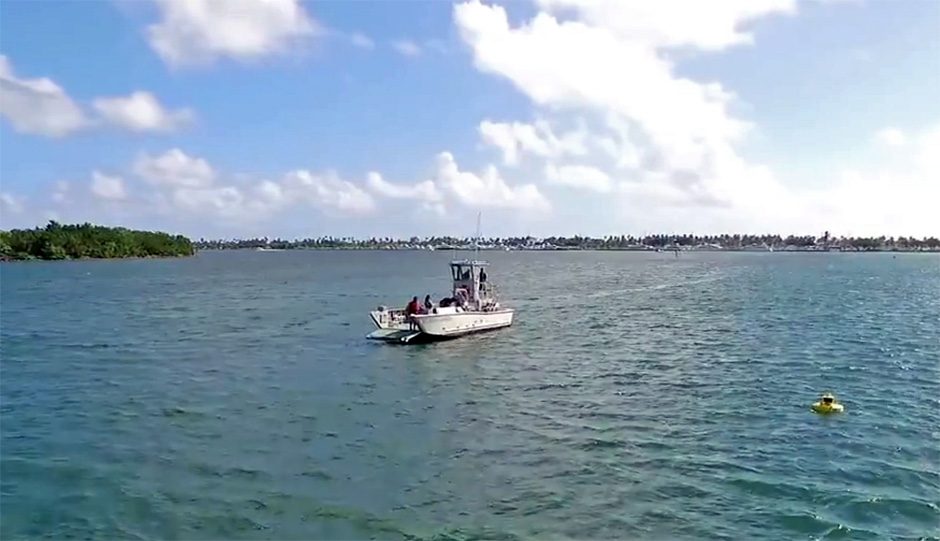 Deploying the red tide watching buoy. (Photo Credit: FIU, https://www.facebook.com/pg/FIUWater/posts/)
At Florida International University (FIU), teams are monitoring for signs of red tide using data buoys, and citizen scientist volunteers are learning how sea level rise is affecting Miami. Brad Schonhoff, the Program Manager for FIU’s Center for Aquatic Chemistry and Environment, Southeast Environmental Research Center, and Institute of Water and the Environment, spoke to EM about these innovative programs.
Data Buoy monitoring for red tide
Red tide outbreaks and similar problems related to harmful algal blooms have been causing public health problems in Florida and elsewhere. And while FIU’s location has not felt a severe impact from red tide yet, the team is already monitoring for them.
“Actually, it’s much less severe where we are,” explains Mr. Schonhoff. “It’s been going on for over a year on the west coast, and the southwest coast in particular. That’s actually a relatively normal occurrence; every other year or yearly, there is some kind of algal bloom.”
In fact, the past year’s red tide has been serious, and for some wildlife, deadly.
“The red tide has been especially bad this year with all the fish kills, and deaths of manatees, sea turtles, and other animals,” details Mr. Schonhoff. “I don’t know if anyone remembers it being that bad before. It is also unusual to have it on the east side for us, but we’ve seen a little bit of it. It’s more north of where I’m located in Miami and North Miami, but that was why we deployed the buoy to be monitoring and seeing if it potentially made its way down further south.”
The dangers from red tide extend to humans, who can experience health problems when exposed to the species of algae responsible for the red tide.
“It’s been especially irritating for people with respiratory issues,” Mr. Schonhoff describes. “On the west coast, the beaches are closed because people can’t get too close without, number one, smelling it, and then number two, feeling irritation with their eyes, throat, and nose. It goes away as soon as they leave the area, but the organism, Karenia brevis, is actually very fragile, and even as the waves are lapping, it gets broken up and aerosolized. It’s then in the air, and that’s what causes irritation for people who are exposed to it.”
Schonhoff represents the Center for Aquatic Chemistry and Environment at FIU, which concerns itself with anything that can be considered a contaminant in water, “And everything in south Florida is very connected by water,” adds Mr. Schonhoff.
“We designed and developed and built these buoys to be able to monitor water quality from the Everglades to the bay in southeast Florida,” continues Mr. Schonhoff. “When we heard that there was Red Tide on the east coast, we deployed one in Biscayne Bay. We have three of them total, to be able to create a kind of transect and see what changes as things move through our waterways.”
Once the team decided to deploy one of the buoys to monitor water quality in the bay, they tried to make sure they wouldn’t miss any important events.
“We set the buoy to monitor every five minutes, and upload data every 15 minutes,” states Mr. Schonhoff. “We look at general water quality conditions, including temperature, DO, pH, turbidity, and especially chlorophyll. We had two sensors for chlorophyll because algae is a photosynthetic organism. That’s how we would potentially have an indication of a bloom: if we see a spike in chlorophyll.”
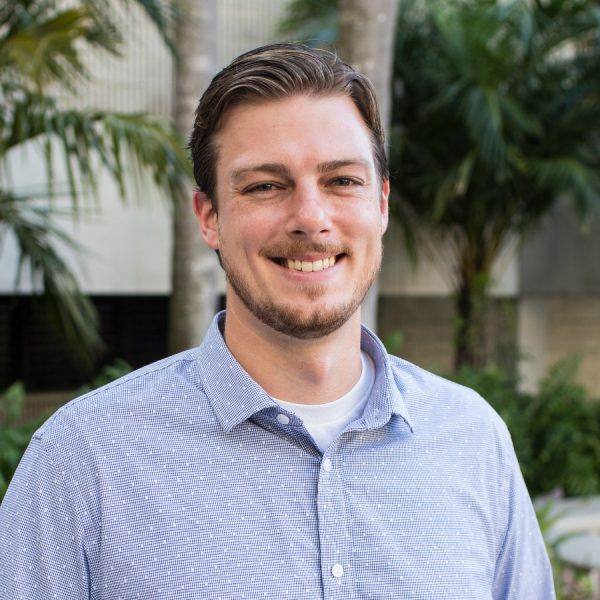
Dr. Brad Schonhoff. (Photo Credit: FIU)
In order to actually test for red tide developing, the team must physically go to the water and respond then, while chlorophyll is spiking, to collect water samples and take them back to the lab for analyses. However, there is more than one cause for most indicators, which makes follow up essential.
“If the turbidity goes up, it could also relate to red tide, but it could also just be that maybe a craft got too close and stirred up the sediment near the buoy,” remarks Mr. Schonhoff. “It’s there to have these indicators that we can then follow up on and say, ‘Okay. Now it looks like we’re seeing increased levels of this, and so let’s go check it out.’ Really only by taking water samples by hand or at the site can we really determine whether or not it’s a problem.”
Some conditions researchers know are more likely to produce a harmful algal bloom, such as calm winds and warm temperatures. This is why they are a good target for real-time monitoring.
“Now, we don’t know for sure that it’s only the one source or anything, but we do know that excess nutrients can contribute,” comments Mr. Schonhoff. “If we can monitor sources of those, it can help keep an eye on algal blooms. Real-time monitoring just gives us a little bit of extra notice to be able to respond. We have it set up so that if levels reach a certain point, it will send us a notification. Then, we go and check it out.”
Responding faster matters to the team. Obviously, it doesn’t take long for blooms to grow, but there are other reasons—not least that there remains a human element in the process, and that takes time.
“The process of actually identifying the species as Karenia brevis, the main culprit for the red tide, that takes a little bit of time in the lab,” details Mr. Schonhoff. “It’s not like we can just go out and immediately determine that’s what it is. If you go out into a bloom and you’re feeling some of those effects that I mentioned, you might get a sense that it’s possibly that, but it’s not something that we can immediately know, certainly, without going there ourselves.”
Citizen scientists watching sea level rise
Miami’s “King Tide” is the year’s highest predicted high tide. It typically happens during September, October, and November, and during these months, water levels are higher than they normally are. King tides are an excellent teaching tool, however, offering a window into a future with rising sea levels; for the past several years, FIU has taken advantage of this natural teaching tool.
“For three years in a row now, we’ve made this a big, public, community event,” Mr. Schonhoff says. “We’re trying to get citizens out and engaged with the issues of sea level rise, and how that turns into urban flooding. During the King Tide season, we get flooding in some of our streets, and the water gets pushed up through storm drains and our underground pipes and systems. It bubbles up through storm drains into the streets. It can get into people’s yards, and even back up into people’s bathrooms depending on where you are and how low line you are.”
Citizen scientists, equipped and trained by the FIU team, are on the scene on key days during the King Tide season.
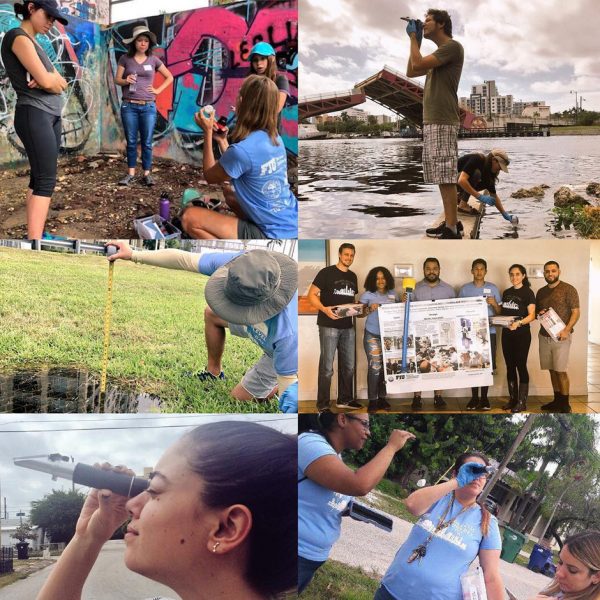
Urban flooding volunteers watch sea levels rise in Miami. (Photo Credit: FIU, https://www.facebook.com/pg/FIUWater/posts/.)
“Everyone meets at a central location, where we give them kits that have some very basic tools for monitoring the flooding,” states Mr. Schonhoff. “We give them a mapped location that is potentially vulnerable to urban flooding. We give them tutorials on how to use everything in the kits, some doughnuts and coffee, and send them out.”
Once onsite, volunteers use the tools in their kits to measure any flooding they observe.
“We’ll send them to parks and neighborhoods where we’ve seen flooding or expect to see flooding, about an hour before the peak high tide,” remarks Mr. Schonhoff. “As the tide comes in and goes out, some of them will see the water rise and fall from the storm drain. Sometimes it won’t go away. They’re measuring the depth of the flood and the salinity to confirm that it is bay water that’s come up and it’s not fresh water that could be from rain or anything else. Checking the salinity confirms that it is driven by sea level rise.”
The team collects water samples onsite for processing later in the lab, and analysis for fecal coliform bacteria, a sign that flood waters are interacting with storm drain or sewage systems. The FIU team got a great response from volunteers at the most recent event.
“We had at least 100 people show up even though we did not see as much flooding this time,” says Mr. Schonhoff. “We don’t really have any control over when we do it and how bad it is. Last year, when we had an event, it wasn’t the official sea-level solutions day, but we had one day where the water was up almost to my knee and I’m about six foot five. But then, when we did this event just a couple Saturdays ago, it wasn’t as bad. There is also some video footage and photos of some of the past events and really extreme cases of flooding that we’ve seen. That also can be eye-opening for people who are joining.”
After the event is over, participants ensure their data is entered into the system for future use—but ultimately the FIU team sees the experience itself as just as valuable.
“Everything is entered into an app that automatically sends the information to a database, and then we go back and track it for quality control,” Mr. Schonhoff offers. “It’s meant to be a community outreach and engagement tool to help educate the public and to get them to witness firsthand that this is happening right now. When you see water up above your ankles just standing in somebody’s neighborhood and driveway, that’s something you can’t unsee. We hope that it has a lasting effect and that people will remain engaged and push for changes.”
One Comment
Leave a Reply


Pingback: Ongoing red tide monitoring in South Florida – CASE NEWS