
Charles River App eases data flow between watershed volunteers and scientists
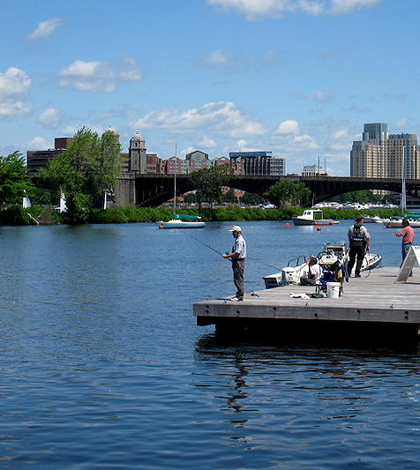
Charles River Esplanade in Boston (Credit: Daderot, via Wikimedia Commons)
New software is making it easier for researchers on Massachusetts’s Charles River to conduct large-scale water monitoring, thanks to a collaboration between a local watershed association and technology company.
The Charles River Watershed Association works to protect the river’s 308-square-mile watershed, but the scope of their monitoring capabilities has been limited by antiquated water monitoring techniques like committing water quality records to paper.
Led by Julie Wood, senior scientist at the CRWA, the group set out to change their old ways in early 2012 by partnering with Aecern, a nearby education and technology company, to begin work on developing the Charles River App.
The Charles River App for the Android platform will allow volunteers to submit data to an online database from smartphones and tablets after measuring the river’s data from standard monitoring equipment. The data can then be reviewed by CRWA scientists.
The app will allow workers to chart water temperature and depth measurements, as well as observations, descriptions and photographs from various sites. Researchers can also upload information about regional wildlife and abnormal river conditions in the Charles River watershed.
The Charles River is an ideal testing location for a water quality app. The river, which flows 80 miles from Hopkinton to Boston Harbor, has been one of the most industrialized, and often polluted, waterways in the nation since being settled by European settlers in the early 1600s.
“A fair amount of progress has been made in the Charles,” Wood said. “Basically, as recent as the 1980s, if someone fell in the river, they had to go to the hospital to get a tetanus shot. Now, hundreds of people use the river every single day.”
Although the river has seen marked improvements in past decades, it still needs monitoring for occasional elevated nutrient levels from industrial pollution and stormwater runoff. These nutrients have caused hazardous algal blooms in the region.

A screenshot of the Charles River app (Credit: CRWA)
Scientists believe that even though the Charles River App is in its infancy, it could have wide-ranging impacts on improving monitoring in the Charles in coming years. Right now the app is only being used by volunteers that work with the association’s monthly monitoring program.
“Once we’re able to develop an iPhone version and fix some of the bugs in the beta version, then it would be great if it were more widely used,” Wood said. “Then we might be able to have data from new sites that we are not currently monitoring. We may have data more frequently than once a month.”
The app aims to streamline the lines of communication between volunteers and CRWA scientists for greater transparency and easier, but the new technology also figures to have applications inside the classroom as well.
The CRWA is partnering with a local elementary school, Woodside Montessori Academy, to develop an interactive website where students can analyze data collected with the app.
“We would like to partner with local schools and get them collecting data and using the app to record it,” Wood said. “Then we have the data, but they also have the dataset that they can use for their own interdisciplinary-type activities. And then we’d like to work with them to develop some educational activities.”
The CRWA is piloting the app with a select group of volunteers, but hopes the program will be widely adopted throughout the year.
Top image: Charles River Esplanade in Boston (Credit: Daderot, via Wikimedia Commons)


0 comments