Data in Action: Heidelberg’s Nutrient Monitoring in Great Lakes Tributaries
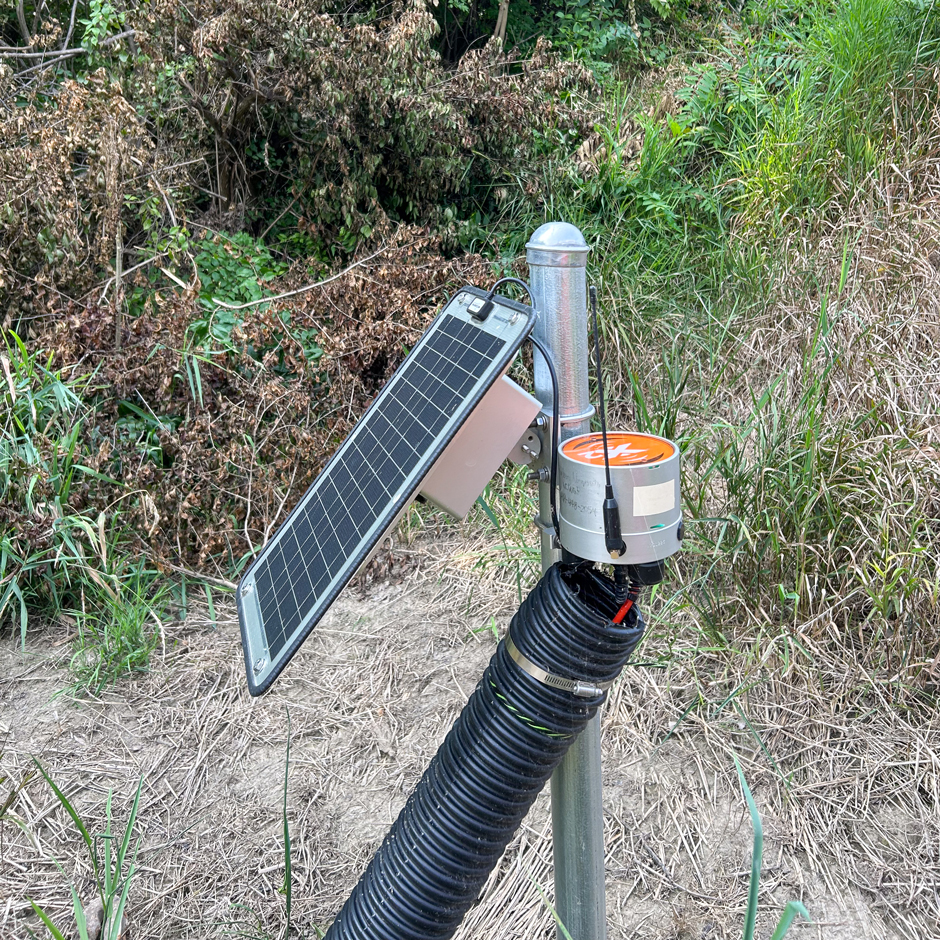 Upper Scioto River sampling site in Kenton, OH. This site does not have a building, so the X2 data logger and sondes, located down in the river, are powered by the solar panel. (Credit: NCWQR)
In the early hours of the morning, when most people have yet to hit snooze for the first time, water sampling sites across Ohio are awake and actively collecting nutrient data. The samplers are active at noon, eight in the evening and four in the morning, but very few people would know or even think about the equipment.
Included in those few is Jakob Boehler, field manager for the National Center for Water Quality Research (NCWQR) at Heidelberg University. For Boehler, these systems booting up every day represents valuable data points that will be used to educate the public, influence environmental policies and support future research.
“There are 20 of these samplers going off across the state of Ohio and Southeast Michigan. Most people don’t realize it or think about it, but I think about it just about every day,” explains Boehler.
Having grown up surrounded by nature, Boehler wanted to find a job wherein he could spend his days working in the outdoors and protecting it. “I’ve always had a really strong passion for being outdoors and in the woods, on the river, in the river fishing, flipping over rocks, looking for bugs—I did that a lot as a kid. So water in general and being outdoors was a big part of my life, and I wanted to try to turn what I liked to do into a career.”
His passion for the environment and increasing public understanding is what drove him to pursue a career at Heidelberg and working with a variety of jobs connected to the NCWQR, like the Sandusky River Watershed Coalition and H2Ohio. “I am always trying to learn how to better educate the public about what we do water quality wise throughout the region,” states Boehler.
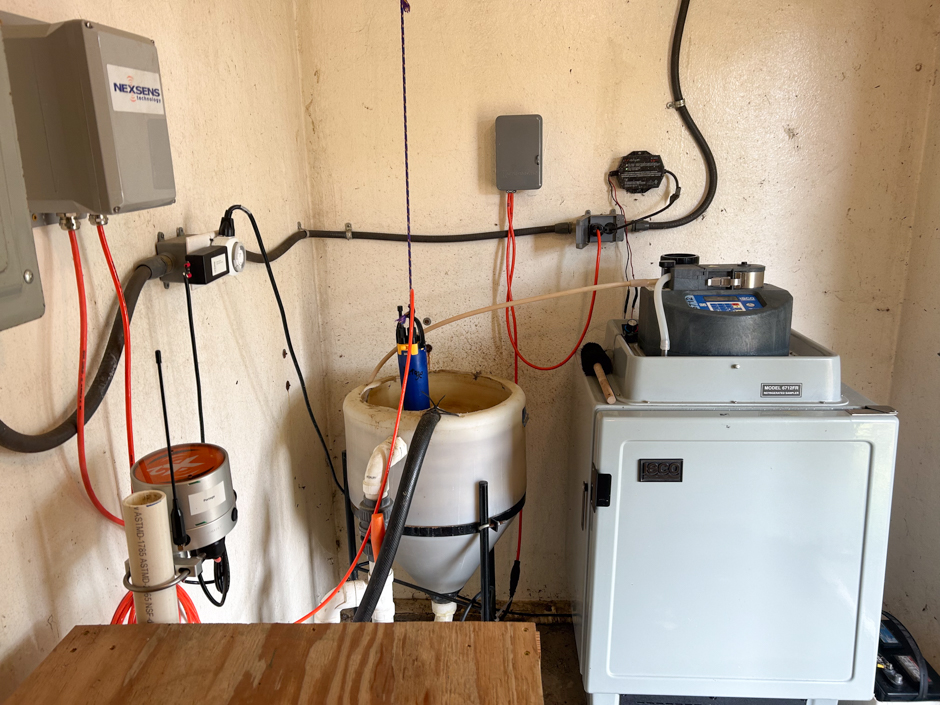
Full station set up deployed at the Portage River HTLP station. This includes an X2 data logger and EXO 2 sonde. This sonde is larger than the EXO 3 sondes and includes extra parameters such as fDOM and ORP. The water coming into the tank is pumped directly from the river and then drains back out of the building to the river. The tank holds enough water to house the sondes and tubing that carries water from the tank over to the ISCO sampler that collects samples three times a day. (Credit: Jakob Boehler / NCWQR)
Gathering Water Quality Data Over Time
Research conducted at the NCWQR focuses primarily on quantifying the amount of nutrients entering Ohio’s streams and rivers, which serve as tributaries for the Great Lakes and Ohio River. These nutrient-rich influxes can lead to algal blooms and similar issues like eutrophication in the Great Lakes. In order to monitor this movement, Heidelberg has set up a series of 23 water sampling sites along the various streams connected to the Great Lakes.
Known as the Heidelberg Tributary Loading Program (HTLP), each of these stations house an automated ISCO sampler and a little over half of them are equipped with a YSI EXO 3 Sonde or TriOS NICO UV Nitrate Sensor. Data is gathered every 10 minutes and then logged and transferred to the cloud with the NexSens X2 Data Logger. The real-time technology of the X2 saves time in the field and transfers the logged data into an online database, WQData LIVE.
For many years, the program ran entirely off of the sampler data, which was taken, collected and assessed over several days, meaning that more common parameters like dissolved oxygen, turbidity, conductivity, pH and temperature were unable to be studied in a meaningful capacity. With funding from the Great Lakes Observing System (GLOS), the introduction of the sondes and X2 data logger allowed the NCWQR to gather more data and build a more comprehensive view of the rivers in the network.
The sondes also serve as a backup to the samplers. Boehler explains, “Let’s say we have an issue with one of our samplers, or something didn’t get analyzed, we can fill in those gaps based off of the turbidity data.” He continues, “In general, it really does help provide me, as the field manager, access for troubleshooting the stations—we’re able to see what’s going on with the sites in real-time.”
At each site, water is bypassed away from the stream by a pump into a small building that houses a receiving tank equipped with an ISCO sampler that samples the water flowing through the tank three times a day: noon, eight in the evening and four in the morning.
Boehler is working on setting up a NexSens X2 data logger for field deployment at an H2Ohio wetland in Seneca County, Ohio. This site will have two NexSens X2 loggers set up with sondes that will allow the research team to assess changes in water quality and nutrient levels upstream and downstream of a wetland in the floodplain of Wolf Creek. (Credit: Austin Nainiger / NCWQR)
Water is also pumped out of the tank, ensuring a continuous flow for the samplers. Successfully collected samples are analyzed for several different forms of nitrogen and phosphorus, as well as silica, fluoride, chloride and several others, totaling around 14 parameters.
Sites equipped with an EXO sonde and data logger benefit from easier troubleshooting and the notifying of issues before data is lost. Boehler explains as an example that conductivity suddenly dropping to near zero would indicate that there is no water in the tank, allowing him to travel to the site to correct the problem. Without the sondes, a blockage would likely only be discovered when the team goes to the station to collect samples.
The sites are paired with U.S. Geological Survey stream flow sites which allow the program to calculate loads of compounds entering a river by combining the concentrations of the compound collected by the samplers and the flow data from USGS.
The monitoring program has been ongoing for the last 50 years and has been instrumental in research surrounding nutrient cycling through rivers and streams. Heidelberg was also one of the first places focusing on nutrient movement through freshwaters, so continuing the program is important.
Boehler says that such long-term sets are valuable but unfortunately rare as funding for projects is often limited. He continues, “This long term monitoring has been going on for 50 plus years which is really important and significant. It’s, as far as we know, the largest dataset of its kind in the world and the data collected is not just used here in the U.S.”
Empowering the Public with Real-Time Data
The main focus of the lab is to track nutrient pollution in the Great Lakes and Ohio River tributaries. Data gathered by the HTLP is used to predict summer algal blooms in Lake Erie. Understanding the movement and concentration of nutrients is important, as the high amounts of phosphorus and nitrogen that enter the lakes may lead to harmful algal blooms (HABs) and dead zones. These blooms can be composed of cyanobacteria, a toxic type of blue-green algae known to cause several health issues in humans.
Monitoring nutrient levels also helps reveal where changes can be made in environmental policy. “Based off of our data, it looks like 80-85% of the nutrients getting out there are coming from agricultural practices. So we need to try to work with [farmers] to address these issues and see what they can do to help reduce that amount,” explains Boehler.
Along with others in the lab, Boehler documents findings from the HTLP to communicate data to state agencies. Since the data from the program is used locally and abroad, it has a place on the annual state budget because the Ohio EPA relies on the data to make decisions regarding what can and can’t happen to rivers and streams in order to protect the environment and human health. As such, the data collected must be good quality.
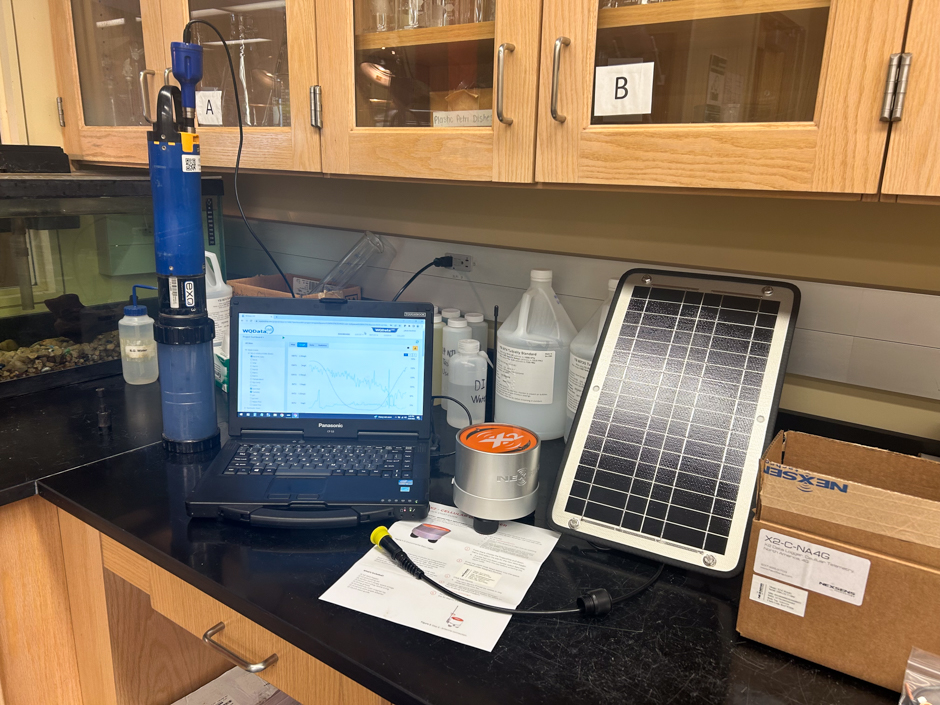
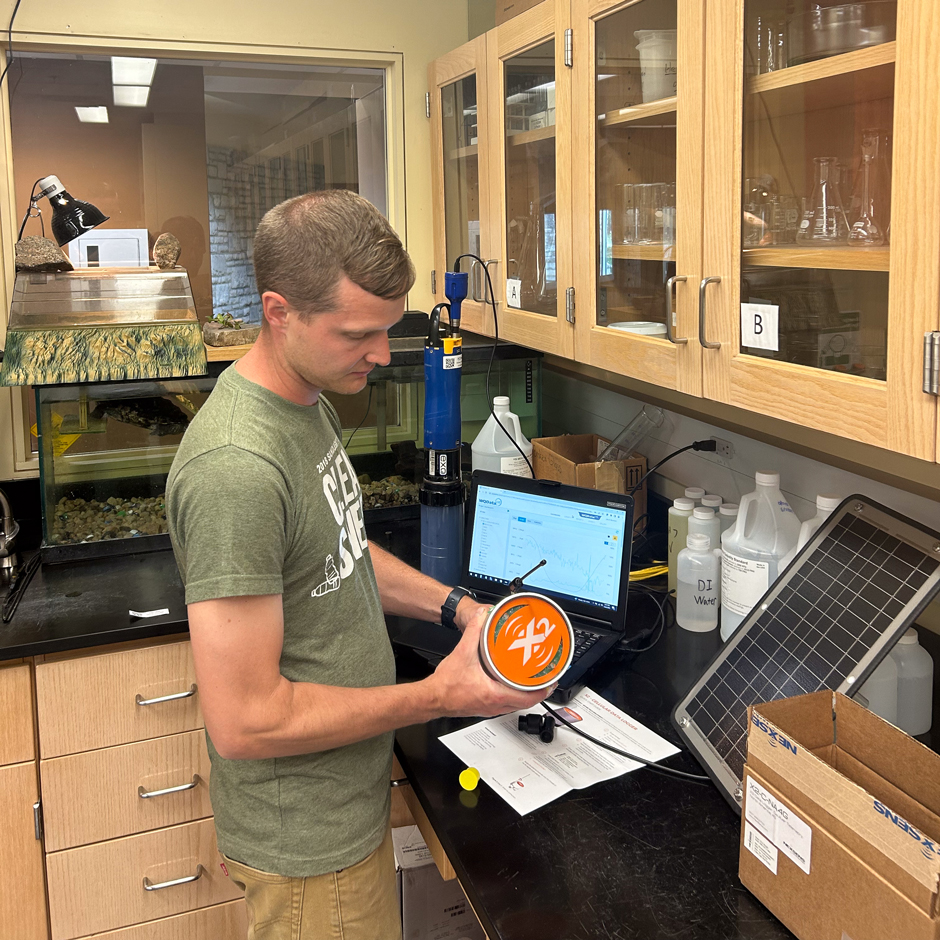
The workbench at the NCWQR is set up for preparing an X2 logger for deployment with an EXO 3 sonde, both of which will be powered by the solar panel in the picture. The WQDataLive portal is open on the laptop with graphs of current nutrient and water quality data from a different sampling location. (Credit: NCWQR)
While quality data is the first step, making the information available to the public is equally important. Heidelberg partnered with GLOS to share nutrient and water quality data collected by the HTLP on GLOS’s Seagull platform. The public can access the data through the Seagull platform, and the researchers and administrators can see a more detailed view of the network through WQData LIVE.
Accessibility goes beyond simply being viewable online—making data comprehendible is also a large part of the NCWQR’s work. Part of the challenges surrounding the program are on the data-gathering side of things with troubleshooting, creating solutions, and conducting fieldwork—others lie on the public side.
“Even though our data is freely available, we don’t necessarily want people to just download it and make their own assumptions about it. We want to help educate people to understand what the data really means. So they’re using it properly,” states Boehler.
Conclusion
Having grown up around water, Boehler spends his days consumed by maintaining their sampling network, educating the public and talking about water quality. “Just seeing people light up like ‘Oh, you know, I get this now. Or, I didn’t know that there were all of these bugs and fish living in the creek’—that kind of thing. And just helping them better understand water quality and see that they’re starting to get passionate about it too—and excited about it! That’s very rewarding,” he explains.
Boehler continues, “Knowing that the work that I do makes a difference in the community to help people better understand water quality, what’s going on in their local streams, and helping to drive policy decisions. He continues, “Knowing that I’m not just making data for the sake of making data—we like to know that it’s getting used—is important and rewarding.”
One Comment
Leave a Reply


Pingback: Research Brief: Drivers and Mechanisms of Harmful Algal Blooms in Grand Lake St. Marys - Lake Scientist