
GIS mapping tool will help Wisconsin fish farm startups plot their ponds
A new tool created by a graduate student and professor from the University of Wisconsin Stevens Point may foster a new entrepreneurial symbiosis between aquaculturists and municipalities.
Chris Hartleb, a biology professor and co-director of the UWSP Northern Aquaculture Demonstration Facility, and Allen Brandt, a UWSP graduate student focused on aquaculture, will soon release a geographic information systems tool that will show aspiring aquaculturists the best places in Wisconsin to start a fish farm.
Hartleb said GIS maps for aquaculture land planning have been created in a few states, but there was still an informational void. “It just seemed like it had been broadly applied and hadn’t been used at a large scale in the industry,” he said.
Aquaculture is prevalent in Wisconsin, with about 2,500 fish farms across the state. “A good chunk of that are more of the personal ponds,” Brandt said.
Still, there are a few hundred commercial operations in the state producing farmed fish for market. Hartleb said he knows several people looking to start a fish farm. Now, they have little choice other than to poke around different plots of land until they find something they think should work.

Allen Brandt
Hartleb saw the need for a guide for entrepreneurs seeking the right plot of land for a new farm. Brandt needed a thesis project. So, the two got to work creating a tool that would give more precision to scouting land for fish farms.
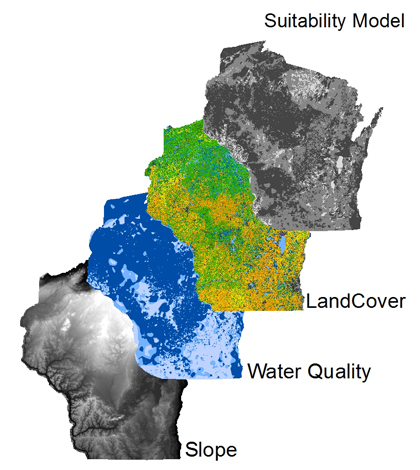
The map will incorporate a GIS map of Wisconsin with different layers of data related to aquaculture. Areas of the state will be graded based on factors like land cover, available land and water quality. Users will also be able to see locations of other fish farms.
Brandt spent some time looking over the farms already in the state to gain some insight into what makes for the best fish farm locations. He analyzed them based on the amount of time the farms have been in business. Then he looked at the land they covered and water quality used in their operations. “The higher longevity, longer-living fish farms had similar water quality between them,” Brandt said.
The farms also usually occupy land near agricultural fields or forested areas, Brandt said.
The pair’s goal was also to collect an extensive list of water quality data parameters from counties in Wisconsin. They wanted to see information on dissolved oxygen, metal concentrations, pH, nutrients, pesticides and more.

Chris Hartleb
Brandt was tasked with gathering water quality data from each county in the state. He gathered county-reported information, as well as data collected by the U.S. Geological Survey and data from the UW Center for Groundwater Studies.
Hartleb said things didn’t go exactly to plan. “We had this long list, but the list became rather short when we looked at it in terms of what data sets are available,” he said.
County-reported data ranged from extensive to downright dry, Brandt said. He found there were four parameters consistently reported by most Wisconsin counties. So water quality ratings for the map focus on pH, alkalinity, temperature and hardness.
Now that the pair has all the data collected, they are in the process of creating the map and programming in models.
There has already been interest in the map from aquaculture professionals and municipalities in the state looking to attract businesses.
Hartleb said they may take their approach to other states where there is an interest in fostering more aquaculture business. He said collaboration with Ohio State University is in the works for an Ohio map.
Once finished, the map will be uploaded to a website so anyone can access it. Brandt said it should be online by the summer.
")
Credit: University of Wisconsin – Stevens Point
Top image: The aquaculture GIS map includes layers of land cover and water quality data (Credit: University of Wisconsin – Stevens Point)

0 comments