
Great Lakes water level monitoring site getting an upgrade
An interactive online tool that monitors water levels in all five Great Lakes will soon have new features that document precipitation and evaporation in the lakes, according to Great Lakes Echo.
Before the upgrade, the Great Lakes Water Level Dashboard only shows average water levels for each lake. Scientists are working to incorporate precipitation and evaporation levels within the month.
The dashboard is a simple interactive graph that shows monthly and annual water level averages for the Great Lakes. Users can easily see average water levels at any time period within the last 153 years.
Data for the dashboard comes from gauges on each lake. The National Oceanic and Atmospheric Administration’s National Ocean Service and the Canadian Hydrographic Service provide most data for the dashboard. Information dating back to the 1800s came from U.S. Army Corps of Engineers surveys.
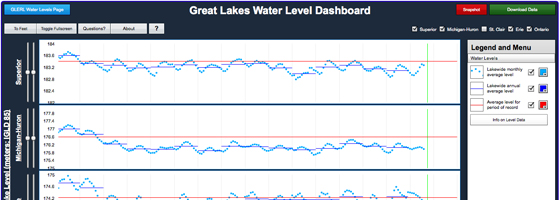
Image: Great Lakes Water Levels Dashboard (Credit: NOAA Great Lakes Environmental Laboratory)


0 comments