
NASA Satellite Images Show Nitrogen Dioxide Emissions Improvements
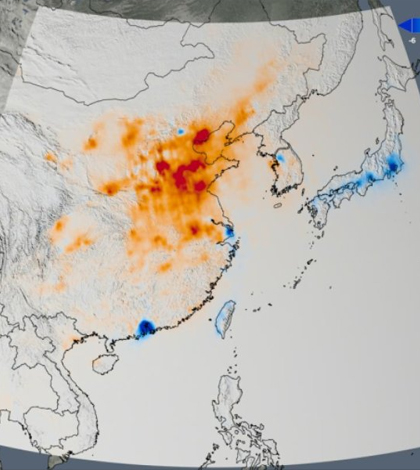
Trend map of East Asia showing the change in nitrogen dioxide emissions across China, South Korea and Japan from 2005 to 2014. (Credit: NASA)
Nitrogen dioxide, a yellowish-brown gas produced by cars, power plants and industrial activity, is a good indicator of pollution levels in regions all over the globe, especially large cities. The gas is often a precursor to ground-level ozone.
The Dutch-Finnish Ozone Monitoring Instrument on NASA’s Aura satellite has been tracking nitrogen dioxide and air quality patterns for 10 years all over the world, in 195 cities, and is revealing that, in many places, environmental regulations have resulted in significant nitrogen dioxide decreases over time, according to a release from NASA/Goddard Space Flight Center.
High-resolution satellite images were taken from 2005 to 2014. Scientists pored over the data, looking for emissions trends and relationships between the images and each region’s gross domestic product, emissions regulations and urban growth. Many areas with emissions regulations in place showed large declines in nitrogen dioxide.
The U.S. showed nitrogen dioxide declines from 20 to 50 percent, while Western Europe’s nitrogen dioxide levels declined 50 percent. These reductions were very important, as the U.S. and Europe are two of the world’s largest nitrogen dioxide emitters.
Top image: Trend map of East Asia showing the change in nitrogen dioxide emissions across China, South Korea and Japan from 2005 to 2014. (Credit: NASA)


0 comments