NCAR Model Gives U. of Texas Researchers Advanced Tool for Predicting La Niña Drought Impact
Latest satellite image of sea surface height. (Courtesy: NASA/JPL-Caltech.)

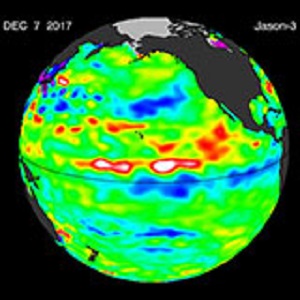
Jason-3 sea level residuals on 12/07/2017. (Courtesy: NASA/JPL-Caltech.)
El Niño and La Niña are recurrent warming and cooling patterns in the tropical Pacific Ocean that affect weather patterns around the world. While El Niño tends to spring up due to a random wind change in the tropical Pacific, La Niña often follows on El Niño’s heels, cooling the tropical Pacific Ocean, causing drought conditions across the southern tier of the US. How long drought will persist due to La Niña is an important question for every community that suffers from extremely dry conditions. Pedro DiNezio, research associate at the University of Texas Institute for Geophysics (UTIG), and his colleague, Yuko Okumura, also a research associate at UTIG, have been hard at work trying to predict how long and how severe drought will be due to La Niña, and they hope to predict the La Niña influence well in advance. The National Center for Atmospheric Research (NCAR) model used in their most recently published study seems to be giving the best estimates yet for predicting La Niña and its drought impact.
“We know that El Niño usually lasts for a year, but La Niña can last a couple years or more. While previous estimates are good for predicting what will happen for one to two seasons, they can’t be used for predicting a multi-year La Niña,” says Okumura.
While Colorado-based NCAR developed the model, DiNezio rigorously tested it based on how well it predicted actual La Niña behavior observed in prior years. DiNezio worked closely with NCAR scientists, extending the predictions to the ongoing La Niña event that began in 2016. This work resulted in a study recently published in Geophysical Research Letters.
The NCAR model seems to capture historical La Niña phenomena well. The forecast simulations were initialized with observed oceanic conditions every November during 1954-2015 and integrated for a decade. The simulation was repeated 40 times for each year. Looking at how most of the simulations turned out, the most likely scenario of what the climate system will do can be predicted. Differences among simulations, on the other hand, provide a range of uncertainties in the predictions.
Many types of oceanic data were used to initialize the NCAR model, including sea surface temperature data from satellite and ship instruments, deeper ocean temperature data, sea surface height data, ocean current data and salinity data. Data was used from as many locations as possible. All the data were combined to create a three-dimensional structure of the global ocean. This structure was used to initialize the model for La Niña predictions. The model was then used to predict the evolution of the climate system based on principles of physics.

Map of sea surface height. (Courtesy: NASA/JPL-Caltech.)
The NCAR model is one of the best climate models for simulating El Niño and La Niña. Multi-year La Niña events can be simulated by only a handful of climate models around the world, including the NCAR model. A major NCAR model breakthrough occurred in 2010, when a new atmospheric convection scheme was incorporated.
The NCAR model showed remarkable skill in predicting the occurrence of multi-year La Niña events that were preceded by a strong El Niño. Strong El Nino events cause massive discharge of oceanic heat out of the equatorial Pacific Ocean, leading to long-lasting La Nina conditions. “When we saw the strong El Niño in 2015, we immediately thought a multi-year La Niña was likely,” Okumura says. The NCAR model forecasts, initialized in November 2015 at the peak of the record-breaking 2015 El Niño event, provide a 60-80% probability of returning La Niña for the upcoming 2017-18 winter. “The data we have seen since 2015 have in fact shown that a multi-year La Niña has unfolded,” says Okumura. “Our current model does seem to be working well.”
Top image: Latest satellite image of ocean levels. (Courtesy: NASA/JPL-Caltech.)


0 comments