Ohio’s Stream Nutrient Assessment Procedure Tracks State’s Nutrient Levels
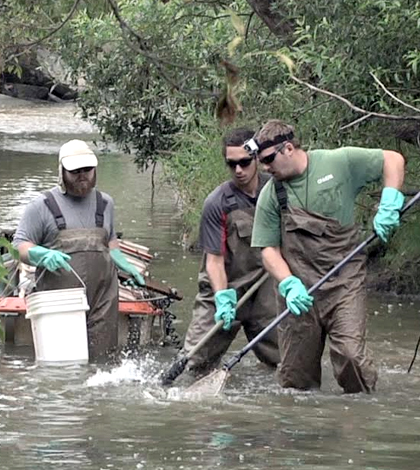
Ohio EPA staff collect fish in the Maumee River watershed near Delta Village. (Credit: Ohio EPA)
Determining whether a chemical is toxic is usually straightforward; if a certain level causes harm to plant and animal life, then that chemical is toxic. Finding whether a nutrient is present at excessive levels is considerably more difficult because, unlike toxins, nutrients do not cause direct harm to plants or animals.
It is clear, however, that problematic nutrient levels exist: For example, a strong influx of phosphorus in certain marine environments can cause a harmful algal bloom, rendering the water lower in oxygen, leading to stress or death of many important marine species, including fish.
Enter Bob Miltner, environmental scientist at Ohio EPA, and his team of experts. Miltner and his colleagues have been working to establish nutrient pollution guidelines for Ohio. Their work over the past 20 years has resulted in the detailed description of relationships between nutrients, enrichment and biological conditions in streams, making it possible to establish numeric endpoints that can be identified for use in management.
However, even in cases where numeric endpoints exceed the criterion value, the risk to aquatic life is not necessarily clear, as it is in the case of toxins. To establish a water quality standard, or to apply one, additional information from a waterbody must be considered and applied as evidence to determine risk and make management decisions.
Miltner and his team developed Ohio’s SNAP (Stream Nutrient Assessment Procedure) in an effort to address current nutrient pollution problems by developing a new water standard that combines water quality indicator information with biological assessments, placing a waterbody on an enrichment continuum. The SNAP has been developed but has not been written into water quality standards.
“SNAP involves collecting water samples to look for specific chemicals. For example, chlorophyll samples are collected from a stream reach and hourly oxygen measurements are taken from the same reach for a 24- to 48-hour period. We use automated data loggers to measure dissolved oxygen in a fixed area of the stream,” Miltner says. “We use the Turner Trilogy to get fluorometry measurements. Concentrations of nutrients such as total phosphorus, total nitrogen, nitrate, nitrite, ammonia, alkalinity are measured in water samples, as well as metals such as iron, zinc, calcium, magnesium, and potassium. We also use mass spectrometry to get metal concentrations. To get pH, we use a field pH meter.” All of these are measured using standard EPA methods.
Data gathering is defined by watershed boundaries, and follows a consistent methodology. A small number of people, usually 3 to 5, are monitoring any given site. Macroinvertebrates and fish samples are collected. Fish specimens are obtained using electrofishing, and macroinvertebrates are collected with D-framed dip nets. Species obtained depend on the size of the stream.
Although assemblages vary from place to place, assemblages are expected to meet certain standards. “We typically do 4 to 5 surveys of defined geographical areas. For example, the Mad River or Stillwater River would be a single survey area,” Miltner says. “A single area might cover 300 to 600 square miles.”
All areas are divided into hydrologic units. The largest unit is the watershed as a whole, followed next in size by a sub-watershed defined by a tributary, then a headwater. The smallest units are about 30 square miles.

The diversity of insects and other macroinvertebrates that Ohio EPA staff collect from a stream can serve as a good indication of water quality. (Credit: Ohio EPA)
A unique feature of Ohio’s system of water quality assessments is that the state uses biological indicators. Fish and macroinvertebrates are used to determine whether a problem exists. “Fish are their own monitoring system,” Miltner says. “Because we aren’t constantly taking water samples, it’s possible to miss a single significant event. But the fish and macroinvertebrates are always there in the stream. If anything large happens, it will be recorded by those assemblages.”
The question still remains of what target levels of nutrients are appropriate for a given fish population. Because the response to nutrients varies depending on environmental factors, those factors need to be considered when setting appropriate targets.
In terms of new technology, Miltner says there are now built-in fluorometry probes for taking chlorophyll measurements. These probes can read levels directly from rocks or from the water column.
“It’s important to note that every river and every region has its own ‘normal,’ and that is one thing that makes defining problematic nutrient levels difficult,” Miltner explains. “For example, in many places, 100 milligrams per square meter would be a very high measurement for benthic chlorophyll. But here in the Midwest, in Ohio, that’s a background level. Benthic chlorophyll levels here are so high because Ohio is densely populated and has working landscapes.”
Miltner does not tackle the enormous task of monitoring Ohio’s rivers and developing SNAP all by himself. While he did a lot of the development of SNAP, he also relied on the input of an external advisory group. In addition, Ohio EPA employs staff biologists and engineers and summer interns from many universities such as Ohio University, Hocking College, Baldwin-Wallace, Miami University, Ohio State University and Indiana University.
Miltner and his team also do community outreach. They participate at conferences, perform demonstrations of electrofishing to high school students, and have a Public Interest Center that is devoted to community outreach.
“All of what we have done is public. After all, the taxpayer has bought our expertise,” Miltner says. “Our biological monitoring program is one of the leading ones in the world, and allows us to craft a weight-of-evidence water quality standard that will be fair and cost-effective.”
Top image: Ohio EPA staff collect fish in the Maumee River watershed near Delta Village. (Credit: Ohio EPA)


0 comments