Sulfur Dioxide: Good News For China, Bad News For India
Ozone Monitoring Instrument (OMI) hardware. (Credit: NASA)
Home to some of the world’s largest cities, such as Beijing, China has long struggled with choking pollution on its overcrowded, bustling city streets. “I have experienced it firsthand,” says Can Li, an Associate Research Scientist at University of Maryland and NASA Goddard Space Center. “Walking on the streets in Beijing can be uncomfortable. It can feel hard to breathe.”
Li and his colleagues have found there has been some good news lately, however. In their latest study, Li and his coworkers found that China has reduced its emissions of sulfur dioxide by 75 percent since 2007, far exceeding expectations. SO2 causes many problems, especially in crowded cities like Beijing. SO2 contributes problems that range from acid rain, to hazy conditions, to affecting heart and lung function of citizens on the ground. Such large reductions in SO2 are welcome news, especially since such low levels weren’t expected until 2030, according to some recent projections.
China’s success with reducing SO2 has resulted from policy changes since the early 2000s that are now yielding significant results. For example, a mandatory policy was implemented where every coal-fired power plant had to utilize scrubbers that were highly effective at removing SO2 from emissions. Newly built factories will also have the scrubber technology plus other safeguards that will improve emissions.
SO2 emissions improvements have been tracked in China in two main ways: bottom up and top down measurements. “Bottom up means measurements or estimates of emissions that are collected from power plants or from automobiles using estimated emission factors. Top down means estimating emissions using the measurements of pollutant amounts in the atmosphere from satellites/aircraft. We then look at the bottom up and top down measurements and see how they compare. Both types of data have shown large reductions in SO2 in China,” says Li.
Bottom up data is difficult and tedious to collect. For example, the amount of SO2 emitted by factories can be calculated by estimating how much power a power plant generates, how much fuel is used and how much emissions would be produced as a result. In many cases, such information is not available for all power generation units, only for the entire industrial sector or an entire nation. And some kind of proxy has to be used to spatially distribute the estimated national total emissions. SO2 emissions from automobiles are normally small, and can be estimated using an activity rate expressing how much emissions a car might make per mile multiplied by an estimated number of cars based on data collected.

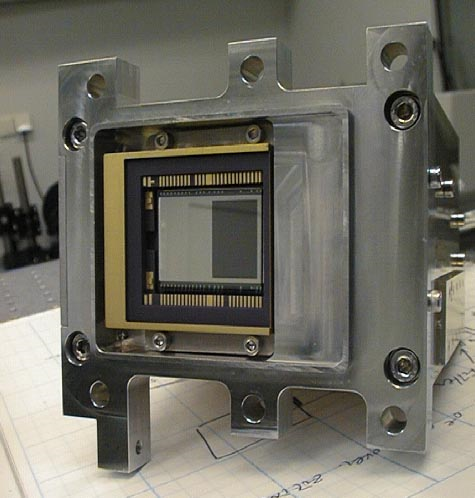
OMI optical bench. (Credit: NASA)
Top down data refers to data collected from atmospheric measurements, for example by satellites, aircraft, or monitors on ground. The measurement for SO2 from satellites is not a direct measurement, but is rather based on UV absorption. Data from the OMI satellite, dating back to 2004, was used in Li’s study. Data was looked at for each year since the 2004 OMI launch. Satellite data was analyzed to estimate emissions from a number of sources (mostly factories) in China and India, and used to estimate the national total of SO2 emissions for each year between 2005 and 2016. The OMI also monitors global NO2 and the hole in the ozone layer. Except for the polar regions, OMI data is currently collected approximately once every two days for a given location on Earth. There is also a Chinese weather aircraft, the Y-12, similar to a Twin Otter aircraft, which provided SO2 data also used in the study.
While raw SO2 numbers indicate part of the picture of China’s pollution, another major factor that influences emissions and their effects on humans is the weather. “While we always have emissions from factories and automobiles, and agricultural land has its own emissions, the actual effect on the ground can vary significantly day to day due to the weather. The wind, under certain conditions, can carry emissions hundreds or even thousands of miles away. The effects of moisture, sunlight, and heat on emissions also play a role in what the person on the street in Beijing or in the country experiences,” says Li.
“The reduction in SO2 has been a big success for China,” says Li. But when asked if that difference can be felt by the average citizen on the ground today, Li says that it probably can’t. “The SO2 is only a fraction of the pollutants that need to be reduced. It contributes to only about 10-20 percent of the fine particle pollution that causes haze. China also needs to reduce other pollutants too to really feel a difference. For example, it will be important to also reduce NOx.”

OMI hardware. (Credit: NASA)
India, on the other hand, has recently seen a huge increase in SO2, 50 percent higher. Recent stories have not only mentioned increased SO2 emissions from more coal-burning factories, but also how trash burning by citizens has caused haze in areas such as Agra, near the Taj Mahal. “Trash burning probably won’t cause an SO2 issue as much as it will increase NOx and possibly heavy metal release into the air,” says Li.
While SO2 decreases in China have been a victory, China will still need to get better reductions in NOx. India, meanwhile, will need to curb both SO2 and NOx emissions. In the future, both nations will also need better, more accurate monitoring of emissions. “We just saw the launch of the TROPospheric Monitoring Instrument (TROPOMI) on the Copernicus Sentinel-5 Precursor European satellite in October of this year, and the JPSS-1/NOAA-20 in November. Both will give us even better monitoring capability for ground emissions,” says Li. “We will be better able to keep track of future emissions and future emissions improvements.”
Top image: OMI hardware. (Credit: NASA)


0 comments