Tide Gauge Data Reveal Multiple US Meteotsunamis Annually
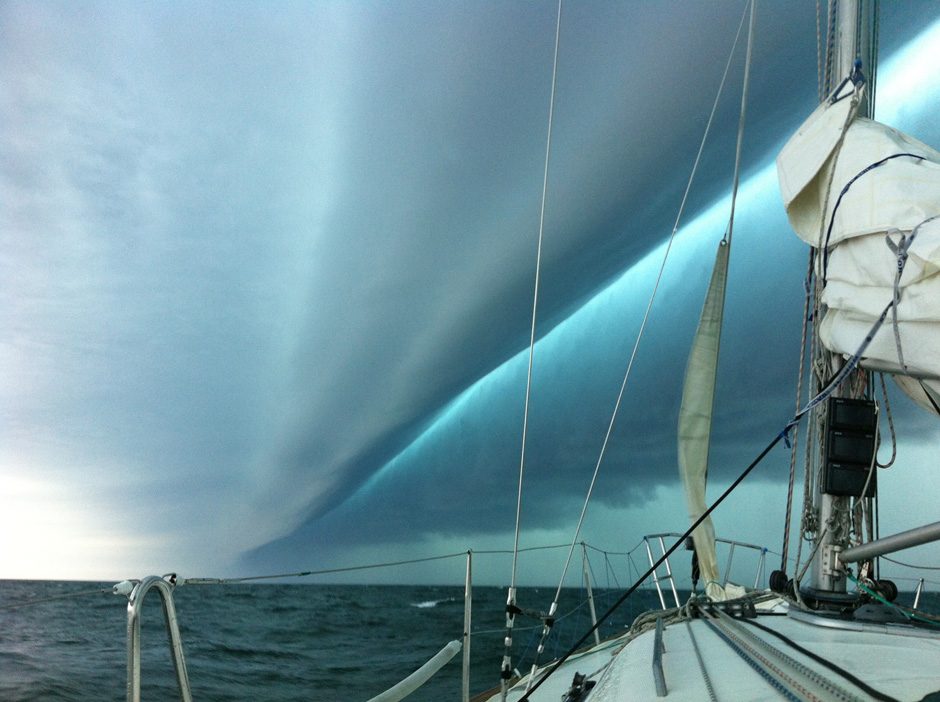 The storm/derecho that caused the June 2013 referenced in the paper. (Credit: Buddy Denham, via source)
Say the word “tsunami” and images of tremendous waves engulfing homes or masses of debris might come to mind. Those tsunamis that are triggered by massive landslides and earthquakes are in fact at that scale.
But weather can trigger more localized “meteotsunamis” as well, and new research shows just how common these are along the East Coast of the United States. National Oceanic and Atmospheric Administration (NOAA) physical oceanographer Gregory Dusek of the National Ocean Service in Silver Spring, Maryland, spoke with us about the work.
“The public noticed the 2013 tsunami event, we did a report summarizing that event in our office, and we started wondering how frequently these actually occur,” explains Dr. Dusek. “At that point, there really hadn’t been any significant work in the US looking at a long data record and trying to determine how often meteotsunamis happen.”
As the team that operates the tide gauges, the tides and currents office at NOAA is uniquely positioned to know what data is available in this area and how to best use it.
“Initially I think people generally thought meteotsunamis were quite rare, at least in the US,” details Dr. Dusek. “There’s a lot of work in the Mediterranean, where they are perhaps a little more destructive and meteotsunamis are a little more common, but in the US I think people thought of these as rare events because the extreme ones don’t happen very frequently.”
In addition, the team noted that much of the previous literature focused primarily on which meteorological conditions tend to drive tsunamis. Thus, they worked to identify those meteorological conditions in the water level data to see if watching meteorological conditions is as predictive of meteotsunamis as we might hope.
Similar results, different coasts
At about the same time as Dr. Dusek’s team was working on this problem, other NOAA and academic colleagues working on the Great Lakes and in the Gulf of Mexico published papers that reflected similar results.
“We found that instead of watching meteorological data, we should be looking at the water level data for the signal we know to expect,” Dr. Dusek describes. “Then we can confirm whether the meteorological data supports what we’re seeing in the water level data. Approaching it that way makes the process much more efficient despite high amounts of data.”
This is new information in part because until more recently, the data simply wasn’t available.
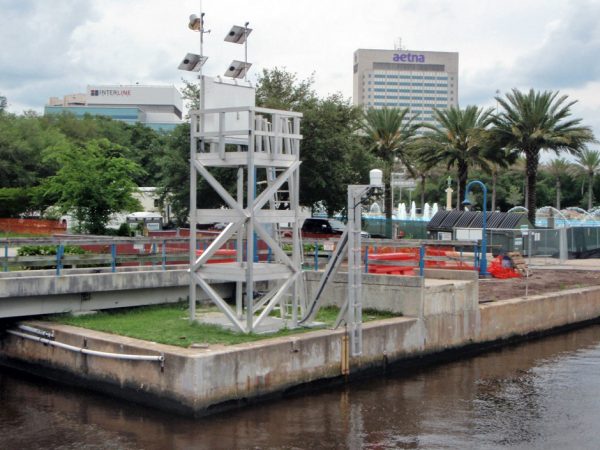
Tide gauge at Jacksonville which shows a Microwave water level sensor near the water and a tower with the data collection platform and meteorological sensors in the background. (Credit: NOAA)
“Until 1996, our tide gauges didn’t retain six-minute water level data,” states Dr. Dusek. “Prior to that it was hourly water levels, and you can’t resolve a meteotsunami with a single data point every hour. There wasn’t an extensive data record to go on really until recently, but since we now have 23 years of data, now we can do the research.”
When the team first developed and tested the algorithm using the 2013 meteotsunami event, they already knew of one additional reported event from that year—and were surprised to detect many more.
“We knew we had two events that we needed to get right and detect, but when we first ran through the data we found many events in 2013,” remarks Dr. Dusek. “I didn’t expect to see that many. I can’t remember the precise number now but in the teens, I think. That was a surprise.”
Once the researchers felt comfortable with how the algorithm was working, they applied it to the data from a greater number of years.
“I started seeing 20 to 30 events every year,” comments Dr. Dusek. “I thought wait, is that right? That seemed crazy, you know, that we’d see that many. We did extensive validation and sure enough, we’re seeing many events, but I think the catch is that the vast majority of them are quite small; unless you’re looking at the data you probably wouldn’t even know they’re happening.”
The team believes that this is part of why these events don’t get reported.
“They’re just in the background, for the most part, a lot of the smaller events under a foot or a foot and a half,” Dr. Dusek says. “Those kinds of events people probably aren’t going to notice. I think that’s why people hadn’t expected to see that many because they occur frequently, but they’re pretty small. It was a big surprise.”
After that initial work, other papers from the Great Lakes and the Gulf, both using the team’s water level data and general approach, saw similar results.
“So it turns out these things happen frequently in all these places across the US, which confirmed what we were seeing,” adds Dr. Dusek.
Warning of meteotsunami hazards
A major takeaway from this research is that about once a year, on average, there is an event that reaches the impactful category, over two feet.
“In any particular location those are a little more rare; if you’re just at one location on the east coast you might go five years before you see an event that large, but as a whole, up and down the east coast, about once per year you have one of those larger events,” explains Dr. Dusek. “Large ones might not be occurring frequently, but they’re occurring frequently enough that we want to make sure we better understand why they’re happening and better provide warnings if we need to.”
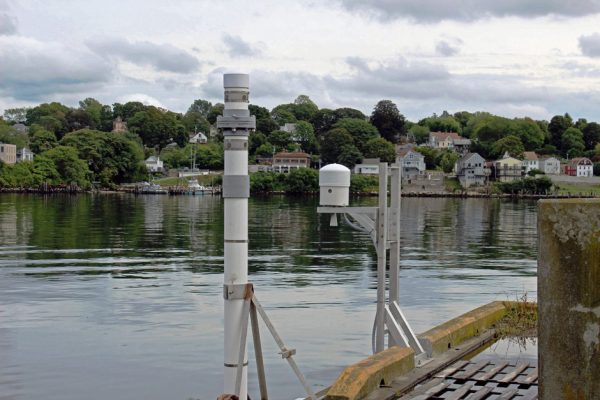
Tide gauge at New London, CT which shows the same type of Microwave water level sensor on the right, and an acoustic water level sensor on the left. These two types of sensors were the ones primarily used to collect the water level data used for this research. (Credit: NOAA)
The team’s goal became determining exactly which meteorological conditions lead to meteotsunamis, and to start by detecting them at all.
“We aimed to associate meteotsunamis and whichever their concurrent meteorological conditions might be,” details Dr. Dusek. “We could then develop a better research strategy for unraveling why specific conditions lead to meteotsunamis more often. You need to know how often they’re occurring as a starting point, to then move on to when and where, and finally, better let people know when to be worried about them or when they might cause impact.”
That’s one of the next tasks for the team: actually employing the algorithm they wrote to warn people in time to save them from harm.
“There’s a bit of lag because you have to have enough data before you can establish that you see a wave, so it wouldn’t necessarily give you warning before it’s arrived on shore,” Dr. Dusek describes. “It might at least give people some notice away from the initial location, though.”
For example, in 2013 the tsunami arrived in New Jersey first, but then several hours passed before it arrived further south along the coast.
“One possibility is trying to implement our approach in a real-time manner to give people additional information in situations like that,” adds Dr. Dusek. “That’s something the National Weather Service is interested in. The NWS houses the tsunami warning center notification network for seismic tsunamis. In the ocean service here at NOAA, we’re exploring whether we can treat these similarly, notifying people right away that there potentially could be a hazard when we detect something somewhere that looks like an event. That’s one thing we’re going to be working on.”
The NOAA team will also be exploring the possibility of applying other types of instrumentation such as high-frequency radar to the problem.
“NOAA helps fund all these radar systems all along the US coast, but also up and down the East Coast, which are predominantly for looking at surface currents,” remarks Dr. Dusek. “They can also detect meteotsunamis because they’re looking at the surface of the ocean. Now that we have this catalog of events, we can better pinpoint how well those systems are picking up the events, and we may also see additional information that could potentially be coupled with the tide gauge data.”
Another future point for research: the connections between summer storms and meteotsunamis.
“A result of the modeling that we found that I wasn’t expecting going into this was that meteotsunamis happen during nor’easters and tropical storms,” comments Dr. Dusek. “In those cases, because there is a storm surge, large waves, and other hazards, from an on-the-ground impact, perspective meteotsunamis might not seem like the biggest priority.”
However, an extra meter or so of water atop storm surge can worsen flooding and inundation.
“We discussed modeling some of these specific events to better understand why they are occurring during tropical storms or nor’easters, and whether we can parse out how much they might contribute to inundation,” Dr. Dusek says. “Is this something we need to be concerned about in some cases with those types of events? That’s something else we’re looking into with some of our partners.”
Right now, the team is prioritizing warning people and a better understanding of whether meteorological conditions are involved.
“Particularly in the summer months, where summer storms and Derechos tend to lead to meteotsunamis, the question is, do these meteorological conditions always lead to meteotsunamis? Dr. Dusek queries. “And what is the threshold, so when the weather service sees these specific conditions they can be ready.”


0 comments