USGS Streamflow Gages Track Ever-Changing Nature Of Nation’s Rivers
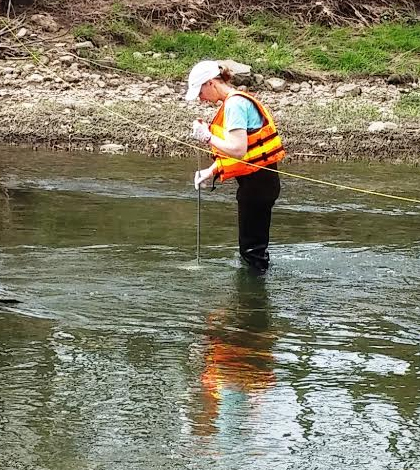
Stephanie Janosy collects a water quality sample using a DH-81 at Tiffin River near Evansport, Ohio. (Credit: Donna Runkle)
Rivers are a fundamental part of the American landscape, determining not only the geological features of the land, but also providing habitat for plants, animals and civilizations.
Although rivers are a permanent part of the landscape, the rivers themselves are constantly changing, flowing at high or low levels, subtly changing course and affecting everything around them. Constantly monitoring the changes is very important, as the data influence flood predictions, show flood frequencies, indicate low-flow behavior, influence recreational pursuits as well as water management practices and can indicate potential improvements in engineering design.
Few people know the temperament of constantly changing rivers as well as Tom Harris, Ohio data chief for the U.S. Geological Survey’s (USGS) Michigan-Ohio Water Science Center. Harris and others maintain about 300 river streamflow gages and 23 lake gages in Ohio in cooperation with 50 federal, state and local agencies. Not only does the Ohio Data Section maintain the streamflow gages, but they check and review the data and are responsible for data dissemination.
Nationally, there are about 8,330 streamflow gages and current conditions for any gaged stream in the United States are available online.
Streamflow gage setups contain a unit to maintain pressure through an orifice line, a pressure sensor, data-collection platform, battery, solar panel and antenna. Some of the latest river gages employ non-contact, radar-based stage sensors. River stage typically is measured and recorded at intervals ranging from 15 to 60 minutes and recorded data are sent to USGS offices each hour.
Streamflow values reported on the Internet are determined from river stage by the use of stage-discharge relations commonly referred to as rating curves. Rating curves are created and maintained based on periodic streamflow measurements and concurrent observations of stage. Streamflow primarily is measured using acoustic Doppler current profilers, however, depending on river conditions, measurements can be made using traditional Price AA meters instead.

Connor Molloy uses a Price AA meter at Wheeling Creek below Blaine, Ohio. (Credit: Steve Fuller)
The streamflow gage houses can be on a 4-feet-by-4-feet platform that is 6-feet tall, however most gagehouses are on a smaller 3-foot high by 2-foot deep metal housing unit. The gage does not touch the water itself, but is rather in contact with the river through the orifice line.
Through the orifice line, a bubbler unit sends air bubbles out to the stream where constant pressure is maintained, but changes in pressure are detected as the river stage changes. The bubbler collects stage data every 15 minutes and transmits stage values every hour.
Streamflow gages are calibrated every seven to eight weeks. This calibration procedure begins with a reading from an outside gage such as a wire weight or staff plate mounted on a bridge and that value is compared to all the electronics inside the gagehouses. The outside gage is the “official” gage, so any reading obtained from the outside gage is compared to what the electronics inside are reading. If there are any discrepancies, the inside gage is set to what the outside reads.
Streamflow gages out on the rivers can have a variety of problems, some of which are pretty low-tech. “Batteries can go dead, gage houses can need cleaning. Sometimes mice build nests in them,” Harris says. “Mice can chew through the wires, too.”
Harris also mentions that while ADCPs are the latest technology for streamflow measurement, sometimes only the old-fashioned Price AA meters will do. “Those have been used by the USGS since the late 1800s,” he said. “But they are still the go-to device in some situations. For example, sometimes the river is too clean to use ADCPs. Other times, the river is too turbid. A too-turbid river can definitely happen in Ohio,” Harris emphasizes.
In terms of processing and disseminating data, Harris relies on about 20 technicians to handle analysis. These technicians are in the Columbus and New Philadelphia offices. They work up all the streamflow records for the Ohio rivers. “Ohio and Michigan are combined now,” says Harris. “But I handle the streamflow gages on the Ohio side and the Michigan side is handled by Tom Weaver who has offices in Lansing, Grayling and Escanaba.”
Harris has been serving the USGS for 23 years and has come to know a great deal about streamflow gage history. “Our oldest gage was established on the Rio Grande River near Embudo, New Mexico in 1889.”
USGS data are widely used. USGS river gage data go directly into National Weather Service models and from there flood warnings are issued. In addition, the general public can use the data as it sees fit, including for recreational activity advisories.
“Discharge data is important, for example,” Harris says. “Because if the river stage is too high, people can’t canoe, among other things.” USGS also provides temperature information. Fishermen can use the information to determine current conditions. But those aren’t the only uses for USGS streamflow data.

Stephanie Janosy collects a water sample in a churn in an ice-covered stream. (Credit: Donna Runkle)
“Engineers can use the streamflow data also to determine flooding frequencies. This information can help them design bridges that really help address flooding possibilities in a realistic way,” Harris says.
Harris emphasizes that the USGS data are available to the public for download and that the public can use them to create their own statistics as needed.
In terms of cutting-edge streamflow technology, Harris says the ADCPs and radar or non-contact stage sensors are fairly new. The radar stage sensor sends out signals from a cone on a bridge and reflects on the water. There are over 40 sites in Ohio that currently use radar. “However, radar units don’t deal with ice-covered rivers very well,” Harris notes. “And in warmer weather, spiders can mess the radar system up by building webs inside them.”
USGS is also trying to go paperless. “We are transitioning everything onto tablets and iPads. We are using air cards to enter measurements right from the field,” Harris adds. “We also have hard copy backups of everything just in case.”
Harris says that the biggest surprise of his streamflow gage work has been the rivers themselves, which are very changeable. “You can go from wading conditions to 8-feet deep in almost no time,” he says.
Although Harris spends a lot of time in the office, he goes out once per quarter to have a look at the river controls. “Things can be altered a lot just by a log or a sandbar. You can also see hydrologic events, anything from floods to long-term droughts,” Harris says.
He and others measure the streamflow every seven weeks to maintain the stage-discharge relationships because rivers constantly change.
“If you’re a field technician in this profession, you need to enjoy being outside. We’re like the postman, we’re out in any kind of weather,” he laughs. “We run to floods like firemen run to fires.”
Top image: Stephanie Janosy collects a water quality sample using a DH-81 at Tiffin River near Evansport, Ohio. (Credit: Donna Runkle)


0 comments