
Using Diatoms as a Water Quality Indicator
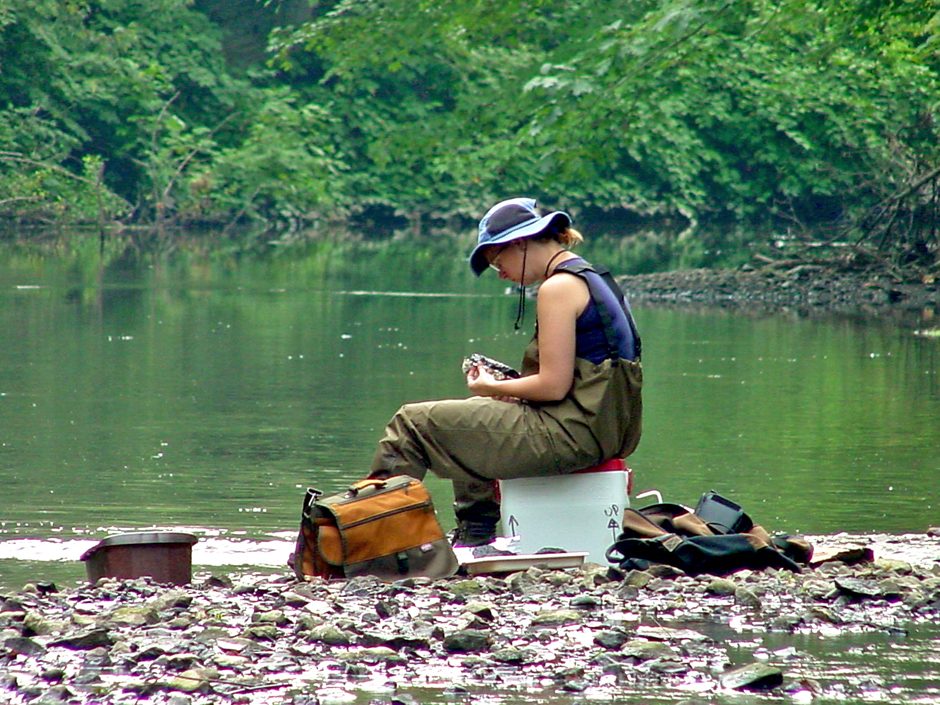 Diane Winter working next to a stream in New Jersey. (Credit: Karen Ponader, via source)
A team from the Academy of Natural Sciences of Drexel University working with New Jersey officials has revealed that the state’s water quality indicators—those specific to nutrients—need some work. But unlike some other approaches that focus on chemical analysis or other biological indicators like the health of benthic macroinvertebrates, this technique is focused on tiny, single-celled diatoms, a form of algae.
Dr. Don Charles, a senior academy scientist and the principal author of a recent paper spoke to EM about the work.
“The New Jersey DEP came to us and said that they were interested in having metrics that better reflected nutrient conditions in the rivers and streams in New Jersey,” explains Dr. Charles. “They have to report a classification of the state’s rivers and streams to the US EPA, and they felt that they were classifying too many of the streams as being impaired—assigned a low ecological condition category—and once a stream got on this list, it was hard to get it off.”
Tom Belton of the NJDEP Office of Science, and other state officials, knew about algae and diatoms and asked Dr. Charles and the team if they would develop diatom-based metrics that more accurately reflected nutrient conditions.
“They didn’t have a lot of money in the beginning, so we basically started in the north and worked our way south through different ecoregions,” details Dr. Charles. “We went through a process of going out, collecting diatom and water chemistry samples, analyzing the diatoms and algae, and then relating species assemblages to nutrients and coming up with a nutrient index. We finished that up around 2000.”
Many different nutrient indices based on diatoms exist, in part because people have been using diatoms for a long period of time, and some of the metrics can be relatively simple—although some are much more complicated and take into account different ecological settings.
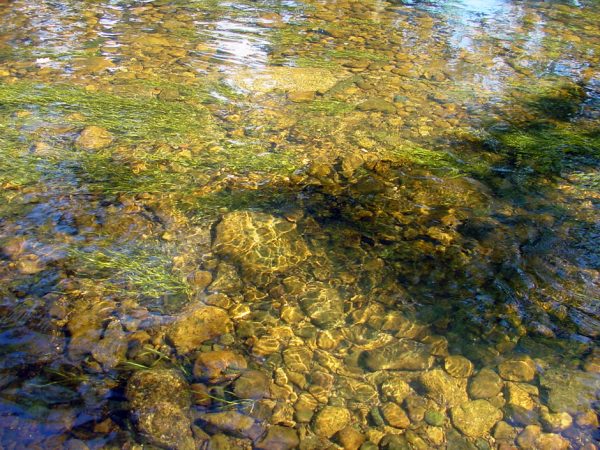
A stream. (Credit: Karen Ponader, via source)
“We came up with a method that used inference modeling,” Dr. Charles describes. “Basically, it’s a quantitative model that takes the diatom assemblage and essentially assigns a coefficient or an indicator value to each taxon in terms of the level of nutrients where it’s most typically found. It’s a little more complicated than this, but you’re basically taking a count of diatoms in a new sample, and then you multiply the number of valves you’ve found of each diatom times its indicator value, and then sum them all up, and take the average, and that’s your index value.”
Although the process is not as cut and dried as taking the area of a circle, for example, the model is reliable and predictable in most situations. It’s important to parse out nutrient effects and other disturbances affecting the diatom assemblages related to things like stormwater runoff, for example.
The team tested whether the diatoms could suss this out in New Jersey.
“The question was, basically, is there a strong enough relationship to nutrients that you can create an index that will help us make a determination of whether we have a nutrient problem or not,” states Dr. Charles. “In particular, if we have to assign a stream reach to an impairment category, would we be able to say the reason for the impairment was nutrients or not nutrients.”
The team needed to determine not just the overall average nutrient conditions in the different streams, but also how much was too much.
“They wanted bright lines or boundaries, so they were wondering if we could develop a way to look at the diatoms and say this site is impaired due to nutrients or this site is not impaired due to nutrients,” comments Dr. Charles. “And so that’s a difficult thing to do because it starts bringing in value judgments and involves an element of subjectivity. They suggested that we try the Biological Condition Gradient (BCG) approach.”
What diatoms reveal about water quality
One of the team’s goals was to ensure they had great water quality data throughout the process.
“I think one of the reasons our approach has worked well is because we put a lot of effort at the very beginning into making sure we had a good selection of sites, good water quality data, that we spent time on the taxonomy, and documented it so it could be applied in the future,” remarks Dr. Charles. “We have data on close to two hundred locations in New Jersey. The study was designed to answer the question of how much variability is associated with different conditions. We find that it’s pretty consistent based on time. Even though the taxonomic mix can change, the ecological indicators you get from it are consistent.”
One of the advantages of using diatoms to monitor water quality is access to more, higher quality information.
“When you do this sampling, the community you collect represents conditions that existed over some number of weeks to months, and it can give you a better measure of long-term conditions than a chemistry measure might,” comments Dr. Charles. “Often when you’re doing the chemistry, you’re just sampling the stream at one time, or maybe a couple of times. If nutrient conditions happen to be unusually high or low during that time, the chemistry measurements will not be indicative of average conditions..”
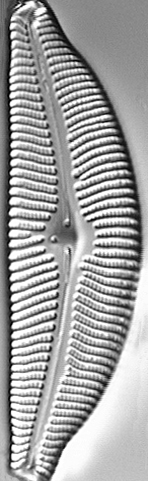
Cymbella tumida. (Credit: taken by diatomists in the Patrick Center, via source)
This begs the question: if you want a biological indicator of nutrients, why look at diatoms as opposed to fish or benthic invertebrates or aquatic macrophytes?
“One is because they’re algae and they depend on nutrients, so they’re more sensitive to nutrients than benthic invertebrates are,” Dr. Charles answers. “There’s also a large number of taxa. In any one sample from New Jersey streams you’re seeing twenty to eighty taxa, and you’re usually counting five or six hundred valves! And so you’ve got a lot of numbers to work with that you can’t usually get with the benthic invertebrates and certainly not with fish. Diatoms are pretty diverse genetically, and they have many different strategies for dealing with a wide range of nutrient levels. So that means there are many different kinds of indicators, and lots of ecological redundancy, information redundancy.”
Diatoms are also inspiring new research into the past—and how to restore more pristine ecological conditions in the future.
“We’re looking at diatoms in sediment cores from New Jersey lakes to see how nutrient conditions have changed over time and in particular to try and get an idea of what nutrient conditions were like before European settlement,” remarks Dr. Charles. “So we can get an idea of how much they’ve changed and so managers that develop strategies to improve them have a baseline knowledge of what they could potentially get back to.”
And perhaps most important? The team has proven not only that diatoms are sensitive to and good indicators of nutrient conditions. They’ve also shown that New Jersey needs to change its criteria for nutrients in streams and rivers.
“Because we applied the biological condition gradient approach that is used by the US EPA, we’re able to categorize sites in terms of level of impairment,” adds Dr. Charles. “If we compare the phosphorus concentrations associated with the boundaries between the impaired sites and unimpaired sites, we find that it’s much lower than the current nutrient criteria that New Jersey uses. So, in order to protect rivers in the state from negative effects of nutrient concentrations, we recommend they reduce their nutrient criteria from one hundred down to fifty micrograms per liter—half of what it is now. And it could certainly be less in some parts of northern New Jersey where current concentrations are already lower than fifty.”
The Biological Condition Gradient (BCG) system
One final important takeaway from this work is the application of the biological condition gradient approach to develop a classification system for waterways—an inherently subjective process.
“A big advantage of the biological condition gradient is that it can be applied in any geographical region or ecological setting. You’re basically working with a scale of disturbance from one to six, where one represents natural conditions, and six represents highly disturbed,” Dr. Charles explains. “These six BCG levels are based on biological communities and ecosystem functions, which can be defined in a variety of different ways, and you’re describing what those conditions are for each of these six disturbance categories. So, the idea is that you could set this up for any group of organisms anywhere in the country, but you have to calibrate it for that particular place.”
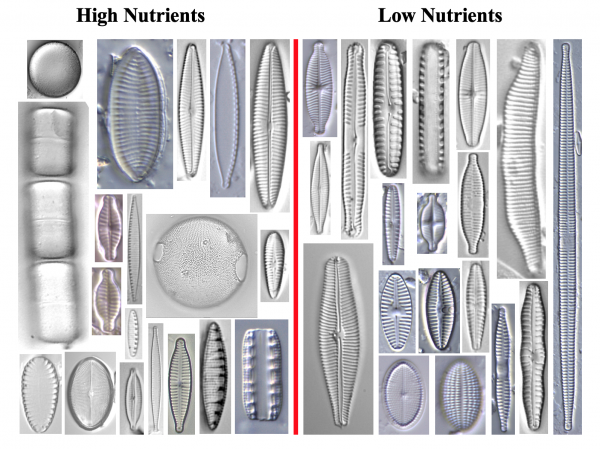
Images of diatom taxa indicating low and high nutrient conditions. (Credit: taken by diatomists in the Patrick Center, via source)
Typically, a panel of experts familiar with the groups of organisms and places they live calibrates the BCG for a particular region. It reviews diatom counts for samples collected from many sites in the region, without being given other information about the sites, and then assigns the sites to one of the six BCG categories. Then the team refines the categories, carefully describing the criteria that they are using to classify a site impaired or unimpaired until they reach an agreement.
“The thing that gives this value in terms of monitoring to me, is that the BCG categories can be linked to the categories that the state uses that are defined in the Clean Water Act,” remarks Dr. Charles. “When the biologists have to make decisions about sites and setting standards or enforcement actions or any number of other things, they have to tie it into categories that are defined in regulations. One of the problems that the biologists have had [in doing assessments] is that they have to give their opinion on a case by case basis, and that was kind of difficult for them. Whereas with the BCG, you’ve gone through this whole process, involved a lot of other people, have documented and described the criteria that you’re going to use for the categorization, so it’s more defensible.”
Coming next for the researchers along these lines: more sites, eDNA, and citizen science.
“Some researchers here including Dr. Marina Potapova are working on approaches using DNA metabarcoding,” Dr. Charles mentions. “The idea of, rather than collecting a sample and doing the analysis under the microscope, collecting a sample and trying to make a determination of what organisms are there from the DNA analysis instead. Not sequencing complete genomes, but short fragments of DNA sufficient to identify most microscopic taxa to be able to say what kind of site the sample came from.”
This kind of expanded identification effort may eventually make the entire area more accessible for everyone—including students and citizen scientists.
“I would like to be working on some ways to make diatom analysis faster and easier so that you can involve people who don’t have to have as much experience and knowledge of diatom taxonomy,” remarks Dr. Charles. “For example, if you wanted to have a group of volunteers doing citizen science. I think it would work well to have some relatively inexpensive or online taxonomic resources for the local diatom flora that people could use to identify the key indicator taxa, and then some simple metrics that they could use. They could count how many of the taxa they had in a sample and use a relatively simple program to calculate metrics that they could either use themselves or they could give to the New Jersey DEP.”


0 comments