Greater Farallones National Marine Sanctuary’s Timely Monitoring Helps Protect Whales From Injury and Death
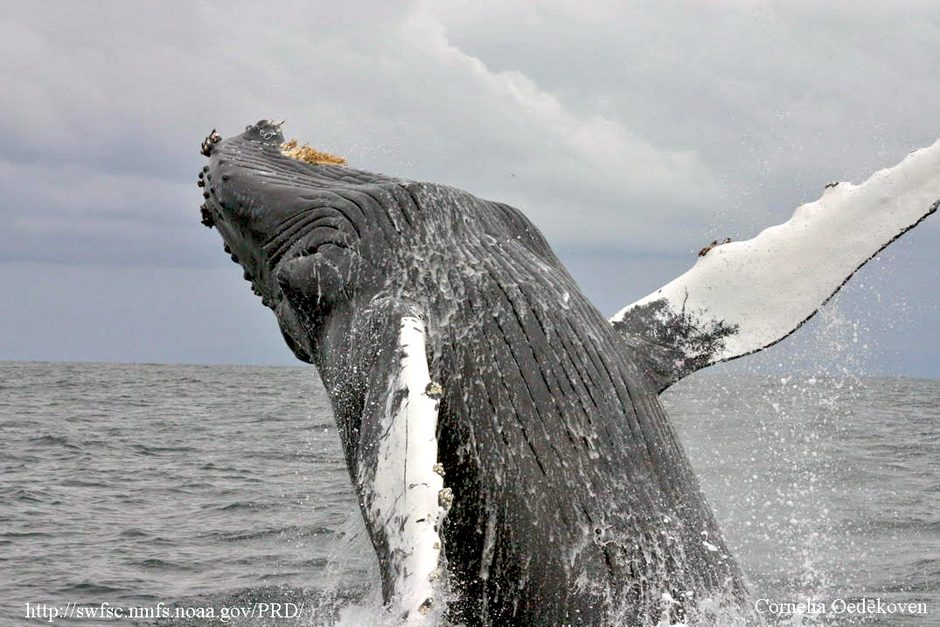
Breaching humpback whale. (Photo Credit: Cornelia Oedekoven/NOAA-PRD Permit)
Jan Roletto, the Research Coordinator for Greater Farallones National Marine Sanctuary which is part of National Ocean Service (NOS) and National Ocean and Atmospheric Administration (NOAA), observes that there are many reasons to do environmental monitoring. “One of the most important reasons is that monitoring can be used to address management issues and look at the effectiveness of management decisions,” she says. Mary Jane Schramm, Media Liaison and Public Outreach Specialist for Greater Farallones National Marine Sanctuary, concurs. “We are using the best available science so we can manage natural areas under our care in the best way possible,” she adds.
Environmental monitoring is done for both long term and short term environmental projects at Greater Farallones. “We do monitoring on our rocky intertidal shoreline beaches, both offshore and near shore,” says Roletto. “Monitoring includes seabirds and marine animals.” Environmental monitoring is done with respect to zoning regulations. “Our rocky intertidal monitoring is statewide over California, especially on the West Coast,” Roletto adds.
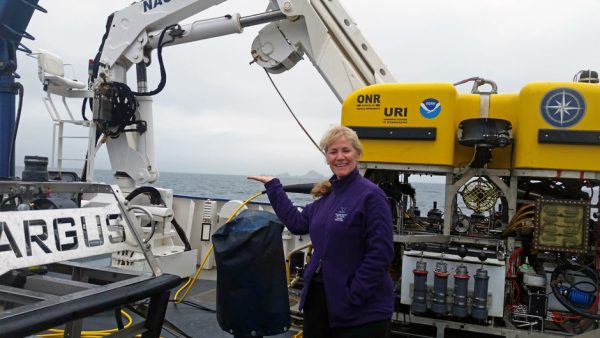
GFNMS Research Coordinator Jan Roletto aboard E/V Nautilus. (Photo Credit: A. Marranzino/NOAA-GFNMS-OET)
Greater Farallones rocky intertidal monitoring has been going on for 21 years. Schramm mentions, “To clarify jurisdictions, these islands, just 28 miles off San Francisco, are not part of the sanctuary, though they are surrounded by it. The islands are a National Wildlife Refuge (Dept. of Interior) vs. our sanctuary’s being under the Dept. of Commerce. With our very proximate urban and suburban human population of nearly eight million, plus industry, this complex ecosystem requires that we manage the area and its land-sea interface and relationships with an integrative approach. Our jurisdiction extends over the ‘wet part’ – the ocean and estuarine waters of the region, reaching up to the mean high tide line. Thus, we obtain permits from U.S. Fish & Wildlife Service to land on the islands to carry out our intertidal work.”
“We don’t monitor the islands themselves, but we are responsible for the surrounding waters,” says Roletto. The U.S. Fish and Wildlife Service monitors the land portion of the islands.
Schramm also mentions that the islands have the distinction of being the largest seabird colony in the contiguous U.S., with over 300,000 nesting seabirds in spring and summer. “The birds act as excellent indicator species to determine the degree of ocean productivity. In years when we have poor oceanic upwelling and food production, seabird die-offs occur. Evidence of this is often found during our Beach Watch surveys. So, whether on foot, using citizen scientists and the simplest of tools, or aboard a sophisticated research vessel with cutting-edge technology, we have a finger on the pulse of our ocean,” she says.
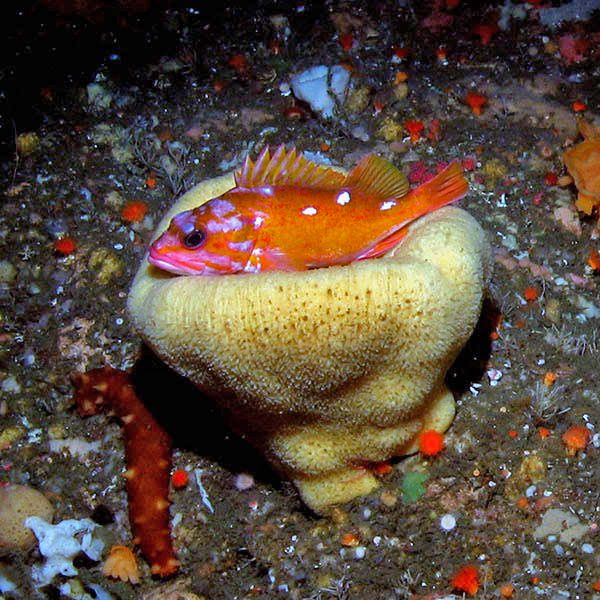
Rosy rockfish resting on deepwater sponge. (Photo Credit: NOAA-GFNMS)
Schramm indicates that the islands and surrounding sanctuary waters function as a “Bed & Breakfast for marine life”: the seabirds, pinnipeds (seals, sea lions, fur seals), and other ocean creatures. The islands/Refuge provide resting and nesting space. “These waters are among the richest on the planet, sufficient to sustain significant populations of great whales such as blue, fin and humpback whales that spend entire seasons feeding here. They’ bank’ enough calories here and in adjacent waters to last them through their winter fasting/breeding season, until their return to our waters in late spring/summer the following year,” says Schramm.
“There is also a Beach Watch program which is 25 years old,” says Roletto. “It involves photographing the beach areas every two weeks, which gives qualitative beach profiles.” Beach Watch does not require much technology. Trained volunteers and staff only need survey forms, field guides, binoculars and GPS embedded cameras to perform beach monitoring. They survey defined beach segments every two weeks. After their survey, volunteers enter their data to an online database and mail in their hard copy forms to staff. Beach Watch looks it over and corrects species identifications and data entry errors.
Other environmental monitoring involves the Applied California Current Ecosystem Survey (ACCESS). This monitoring is conducted from a boat three or four times a year and encompasses birds, mammals, shipping traffic and/or the presence of marine debris. The ACCESS project covers the head of Bodega to Half Moon Bay. It is a fine-scale regional survey of wildlife population assessment data.
“Shipping traffic is a big influence here,” Roletto emphasizes. “We have three lanes of shipping traffic and a narrow inlet at the Golden Gate Bridge Strait. It’s a mile across. Ships and marine animals, especially large ones like whales, can collide.”
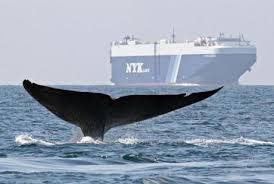
Blue whale in shipping lanes. (Photo Credit: John Calambokidis/Cascadia Research)
To do monitoring of marine species in San Francisco Bay, a glorified acoustic fish finder, an EK60, is used to sample the water column acoustically. The EK60 uses different frequencies to find fish and zooplankton, including krill. Results are coordinated with Cordell Bank National Marine Sanctuary and Point Blue Conservation Science. There are surface visual observations, net tows and water samples taken that have been ongoing since 2004. At three to four surveys per year, it is one of the longest term, oceanographic and biological monitoring programs along the West Coast. Birds, mammals and krill data are taken and used to model ecological hot spots and foraging behavior. This modeling data is then overlapped with large ship movement data. “We look at typical movement patterns of large marine mammals, such as baleen whales, then overlap with shipping movement data, and see what the risk level is of the whales being injured or killed by ships,” says Roletto. “We hope to get ships to avoid typical whale hotspots and thus lower risk for the whales.”
The AIS, or Automatic Identification System, is a key component of this voluntary speed reduction program, says Schramm. “The automatic identification system (AIS) uses transponders on ships and is used by vessel traffic services (VTS) to monitor, identify, and track shipping. It shows each vessel’s unique identification, position, course, and speed,” she mentions. The AIS tells the computer how fast the ship is going and which ship it is, and this information is coupled with where the whales’ food is likely to be. “All this information is used to list where voluntary speed reduction by ships might be helpful. Whales tend to arrive in the area in May and leave in mid-November. During that time, we advise that ships go more slowly to avoid harm to the whales,” says Roletto. “A ship going 15 nautical miles will kill whales if they collide. At 12 nautical miles, there are fewer deaths, and at 10 nautical miles, about 50 percent of the whales will survive a ship strike.”
Two types of nets are used to calibrate the EK 60 acoustic sampling of krill and fish in the water column. A Tucker trawl samples throughout the water column and at two separate depths, one near the bottom, and one trawl through the highest density of zooplankton as identified by the EK 60 acoustic signals. There is also a shallow water net, a hoop net for the middle of the water column between 50 to 100 meters depth.
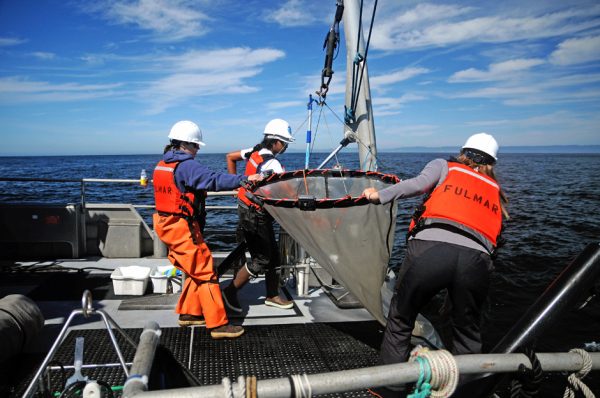
ACCESS scientists deploy a hoop net from R/V Fulmer to collect zooplankton from 50-100 meter depth, in Greater Farallones, Cordell Bank and Monterey Bay National Marine Sanctuaries. (Photo credit: ACCESS Point Blue/ONMS)
“Knowing what the whole California Current is doing is helpful,” says Roletto. “We rely on other research to look at the health of the entire California Current ecosystem from the Oregon and California coasts, from Washington to Pt. Conception South and compare ecosystem conditions with our regional assessment. We look at humpback and blue whale behavior.”
Whales tend to forage at the shelf break. “The continental shelf abruptly drops at 100-200 meters,” says Roletto. “That’s where the zooplankton concentrate, so that’s also where the whales go to forage.”
But where the whales forage, and how likely they are to cross paths with ships, is also a function of how much food there is, which is somewhat dependent on weather conditions. “In poor food years, such as 2014-2015 when there was a marine heat wave, and in 2016 when there was an El Niño, the whales become concentrated on the central coast near the continental shelf break and across the shelf, closer to shore and co-occurring with the shipping lanes. That’s because they need to forage more widely to find food. Unfortunately, the more they spread out, the more likely they will encounter ships,” explains Roletto.
The continental shelf is very broad by San Francisco. “Whales are looking for krill, and the shipping lanes are also over the continental shelf. So more whales will encounter ships there and are more likely to get injured or die when they strike ships. While there isn’t really much chance we can convince whales to change their behavior to prevent them from encountering ships, we can try to change human behavior to keep the ships out of the whales’ way,” she adds.
With all their advanced data and modeling, it is now possible to determine within a few kilometers where krill are likely to be and where whales will follow. “We have worked with the coast guard to change shipping lanes to reduce high co-occurrence of whales foraging areas and ships, and we recommend to ship captains to voluntarily lower their speeds to lower whale mortality,” Roletto emphasizes. In addition to changing shipping lanes to avoid whale “hot spots,” Greater Farallones National Marine Sanctuary has helped in the development of West Coast Whale Alert, to get data on whale locations that can be shared with ship traffic.
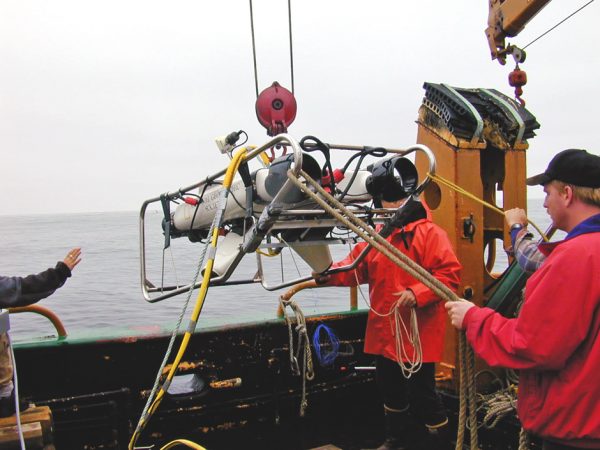
Deployment of a camera sled from NOAA Ship Mac Arthur II. (Photo Credit: NOAA-GFNMS)
Yet another factor that affects zooplankton is ocean acidification. “We do water sampling for pH and collect water samples. If the water is too acidic, zooplankton are negatively affected. We use the CTD for that work. We also have students collect the samples. They measure primary productivity and measure pH in the lab. Water samples are sent to Bodega Marine Lab.”
Another research project not previously mentioned is the Deep Sea Benthic Habitat project. Greater Farallones has a benthic mapping and characterization project, where areas on the bottom of the ocean floor are mapped and then observed and specimens collected using an ROV. This work has been done via the highly sophisticated NOAA ship Bell M. Shimada and E/V Nautilus, especially multi-beam imaging of deep sea/benthic communities. Multi-beam backscatter equipment is used for ocean floor mapping. This includes information such as depth, contour and how hard the bottom is. Once the maps are completed the hard, soft and mixed substrates can be identified and then fine scale, visual investigations using ROV and AUVs. “We look for larval fish and eggs, and habitat features. We can look at large corals on large flat ocean bottoms,” says Roletto.
NOAA’s National Marine Fisheries Service and the Pacific Fisheries Management Council use the data obtained by Greater Farallones Marine Lab. “We don’t regulate fisheries, but we can make recommendations,” Roletto emphasizes.
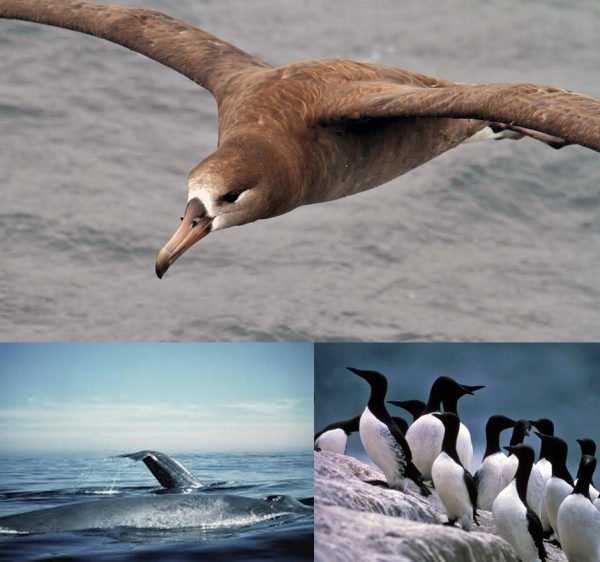
(top) Black-footed Albatross that nests in the NW Hawaiian Islands but migrates thousands of miles to GFNMS to feed. (Photo Credit: Jamie Hall/ACCESS-Pt. Blue-GFNMS) (left) Feeding blue whales in GFNMS; believed to breed off Mexico/Central America. (Photo Credit: Dan Shapiro, NOAA (right) Common Murres nearly wiped out by egg harvesters during the Gold Rush. Now increasing due to legal protections and abundant food in GFNMS. (Photo Credit: GFNMS Library)
With their ROVs and AUVs, they can observe to 3000 meters under the sea.
In summary, Schramm says, “The science we do here at Greater Farallones National Marine Sanctuary is the best available science. We are working on expanding our geographical range and continuing to get the fine scale data we need to do cutting edge research. Maintaining healthy ocean habitat is essential for maintaining healthy fisheries and other marine life, and that has always been the primary goal for us. Come visit us and see your tax dollars at work!”
See the OET website for additional info about ROV and multibeam/backscatter data collection for mapping seafloor habitat: https://nautiluslive.org/
See MARE for another ROV overview. https://www.maregroup.org/


0 comments