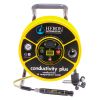
Solinst Model 107 TLC Meters
Features
- Accuracy is to the greater of 100 uS or 5% of reading
- LCD simultaneously displays temperature & conductivity
- Built with rugged Solinst reel and accurate flat-tape marked every 1/100' or each mm
- Free ground shipping
- Expedited repair and warranty service
- Lifetime technical support
- More
Overview
The Solinst TLC Meter is ideal for profiling conductivity and temperature in wells and open water. It displays accurate measurements of conductivity and temperature on a convenient LCD display. Conductivity measurements are read from 0-80,000 uS/cm with readings giving accuracy of 5% of reading or 100 uS (whichever is greater). Water level and probe depth measurements are read off the Solinst durable PVDF flat tape, which is accurately laser marked every 1/100 ft or each millimeter. Tape lengths are now available up to 1000 ft (300m).
Design
The high quality PVDF flat tape reels smoothly, remains flexible and hangs straight in the well, irrespective of temperature. The flat tape is mounted on a sturdy, well-balanced Solinst reel, with a convenient battery drawer for the 9 Volt alkaline battery. Permanent laser markings each 1/100 ft or millimeter allow accurate readings. Stranded stainless steel conductors and copper coated stainless steel conductors resist corrosion, provide strength and are non-stretch. They make the tape easy to repair and splice. The dog-bone design reduces adherence to wet surfaces.
Mechanics
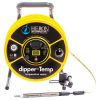
The Solinst TLC Meter uses a ‘smart’ conductivity sensor with platinum electrodes to measure conductivity. The conductivity is displayed on the screen along with the associated temperature measurement. The ‘smart probe’ displays conductivity that has been standardized to 25 C, i.e. Specific Conductance (displayed as EC). The conductance temperature coefficient is 2.0% per C. Calibration is simple, using 1413 uS, 5000 uS, 12,880 uS, and/or 80,000 uS solutions for 1, 2, 3, or 4 point manual conductivity calibrations.
- (1) Model 107 TLC meter
- (1) Tape guide/datum
Select Options


In The News

Source Water Monitoring in Albany, New York: Tracing Water Quality throughout Tributaries
Thousands of US cities pull their drinking water from natural source waters like reservoirs, rivers, and streams, making overall watershed health a key consideration for water providers. In Albany, New York, the Albany Department of Water and Water Supply delivers drinking water to over 100,000 residents as well as monitors and manages the larger drinking water supply watershed. Hannah Doherty, Environmental Specialist at the Albany Department of Water and Water Supply , spends her days working with a small team to monitor the drinking supply and the connected water bodies. Doherty explains, “We’re the first to encounter the water that ends up being the drinking water.
Read More
Wildfire Prevention in the Sierra Nevada Region with the Yuba Watershed Institute
Though recent wildfires have sparked new conversations about wildfire management and response, groups like the Yuba Watershed Institute have been monitoring the forests and water resources of the Sierra Nevada region for decades, managing approximately 5,000 acres of land with the Bureau of Land Management (BLM) and about 7,000 acres in private land partnerships. The goal of the Institute is to work with local communities and land agencies to improve watershed and forestry management through informed practices and public outreach. The goals of the Yuba Watershed Institute are three-fold: Improve the ability of fire suppression agencies like the California Department of Forestry and Fire Protection ( CAL FIRE ) and the US Forest Service.
Read More
Wave Sensors Integration with NexSens Buoys: A Cutting-Edge Solution for Wave Measurment
Real-time wave data supports accurate weather prediction, safe and efficient maritime operations, and provides valuable safety and operating condition information for recreation and commercial fishing. Understanding wave dynamics also helps with the design of protective coastal structures like seawalls, breakwaters, and jetties. It also supports better prediction of their impact on sediment transport and coastal geomorphology. Wave data is a key factor in qualifying and designing offshore wind farms and harnessing kinetic energy for electrical generation. It helps with the understanding of ocean-atmosphere interactions and contributes to studies of sea-level rise and climate change impacts.
Read More