Modeling Ohio River chlorophyll using satellite imagery
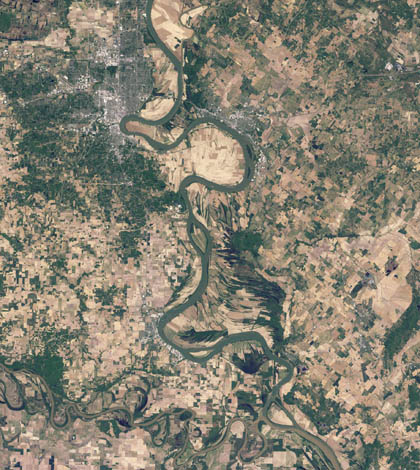
The Ohio River near the J.T. Myers Lock and Dam as captured by Landsat 5 satellite in 2010. (Credit: NASA)
Studying algal blooms in lakes, oceans or marine systems is relatively simple since blooms tend to concentrate at the surface. But studying the blooms in a river is much different. Flowing water tends to mix the algae from top to bottom.
That’s the case in the Ohio River, where Marshall University researchers are studying chlorophyll concentrations as a surrogate for algae. Key to their effort are images from the Landsat 8 satellite that can capture large sections of the river in a single snap. Scientists then ground-truth what the satellite finds with water samples. By combining the two approaches, researchers hope to develop a reliable way of estimating chlorophyll levels within the river using satellite images alone.
“When you have a long river, and the Ohio’s close to 1000 miles long, typical sampling would take a liter of water every 80 miles or so and you do that about every two weeks,” said Jeff Kovatch, associate professor of biological sciences at Marshall University. He is completing the work with Thaddaeus Tuggle, a graduate student in his lab. “Well, the river doesn’t sit still to capture the concentrations.”
The advantage that satellite technology provides is the capability to capture hundreds of miles of river in just one image, he says. That lets researchers see changes in chlorophyll concentrations over a much broader area than typical sampling.
After the satellite collects its images, the values for light reflectance and absorption that it picks up are matched to the ground-truth data collected by Kovatch and others in the Ohio River’s Greenup pool. They go about 30 meters offshore, where the river is well mixed, and collect samples using grab samplers. Collection takes place at three different locations at the same time on a given day. Different types of chlorophyll, a and b, are monitored by YSI sondes deployed along the pool while chlorophyll c is calculated in the lab.
“That involves us going out, collecting the water samples and doing a chlorophyll extraction,” said Kovatch. “We use that to fit a model of the different band values to different concentrations of chlorophyll.”
When comparing the model that he’s helped develop with Tuggle, Kovatch says that it predicts chlorophyll concentrations really well. He declined to share an estimate of the model’s accuracy until after the final paper detailing the research is published, but he did have some plans for future studies that might use the model.
“We would be able, from the comfort of one’s computer, be able to sample chlorophyll concentrations across the entire Ohio River,” said Kovatch. “In terms of time and money, we could collect a lot of detailed data quickly.”
In addition, by using historical images from NASA, Kovatch says it could be possible to extract the Ohio River’s past concentrations.
“If we can do that, we can get a 30-year data set, a temporal and spatial data set relating to the Ohio River,” said Kovatch.
Top image: The Ohio River near the J.T. Myers Lock and Dam as captured by Landsat 5 satellite in 2010. (Credit: NASA)


0 comments