Northcentral Pennsylvania’s Expansive Monitoring Network Informs Watershed Management
In 2011, the Loyalsock Watershed in Northcentral Pennsylvania was hit hard by two hurricanes, Lee and Irene, that arrived only days apart. The flooding was intense, with over a foot of rain that caused nearby creeks and the mainstem Susquehanna to rise.
Residents saw fish swimming in the flooded streets, bridges and roadways were damaged or destroyed, and the Williamsburg Airport was closed for months due to damage to the roadways. Aside from damage to man-made structures, biologists and ecologists were also worried about the flood’s impact on wildlife.
Fortunately, earlier stream assessments in July of that year, as part of Susquehanna University’s (SU) sampling for the Unassessed Waters Program, provided essential pre-data to future post-flood research.
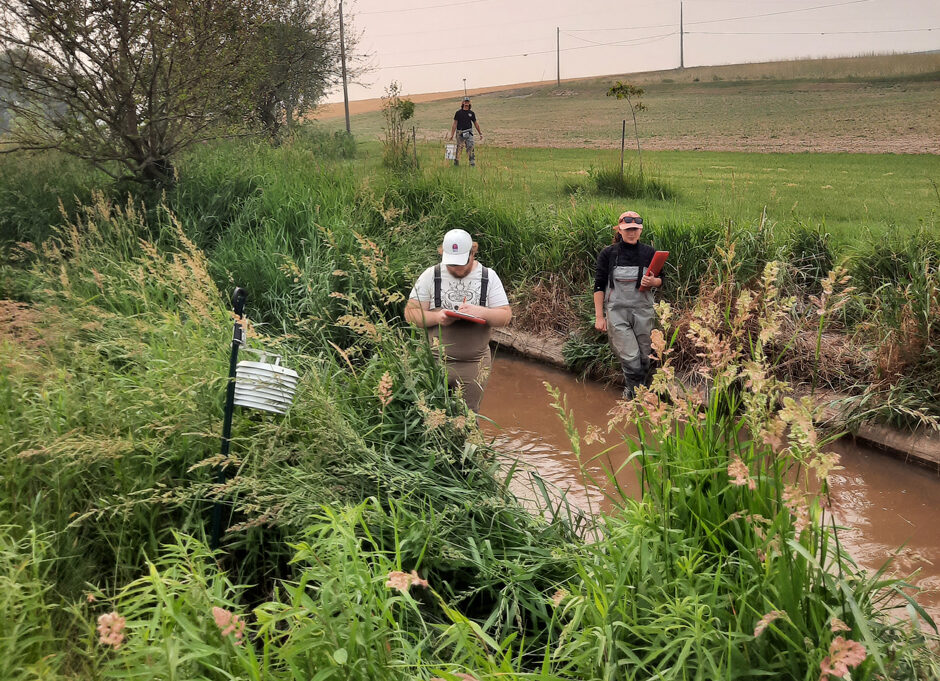
Jacob Winters and Sara Richard mapping logger placement in Turtle Creek. (Credit: Dan Ressler / Susquehanna University)
Monitoring Trout and Water Quality Post-Flood in Northcentral Pennsylvania
Researchers from SU surveyed the fish populations in the Loyalsock Watershed, focusing particularly on trout. Before the hurricanes, the goal of the program was just to evaluate trout stocks in these waterways. After, the researchers were hoping to use the pre-data in order to identify how the flood impacted the local trout population.
In 2019, Matt Wilson–Director of the Freshwater Research Institute and Center for Environmental Education and Research Field Station at SU–joined the project and wanted to add a new perspective and layer of data to the project.
“When I started in 2019, I realized there wasn’t any abiotic data to go with the fish data, but fish are dependent on their habitat and water quality,” explains Wilson.
So, in 2021, Wilson piloted habitat and substrate data collection alongside the fish assessment using a YSI handheld. The following year, the program underwent a major expansion.
In place of spot sampling once a year with the handheld, Wilson deployed a series of HOBO temperature pendants and pressure transducers to measure water temperature and depth in the Loyalsock Watershed, as well as two neighboring watersheds, Pine Creek and Kettle Creek.
Today, 58 pressure transducers and 55 temperature pendants are deployed in headwaters across the three watersheds. The swap to the loggers allowed for higher-frequency data collection over a longer period of time, capturing a more complete picture of conditions in each watershed.
This increase in resolution and the added spatial coverage of the other two watersheds provide more evidence and comparison to support answers to the program’s driving research questions.
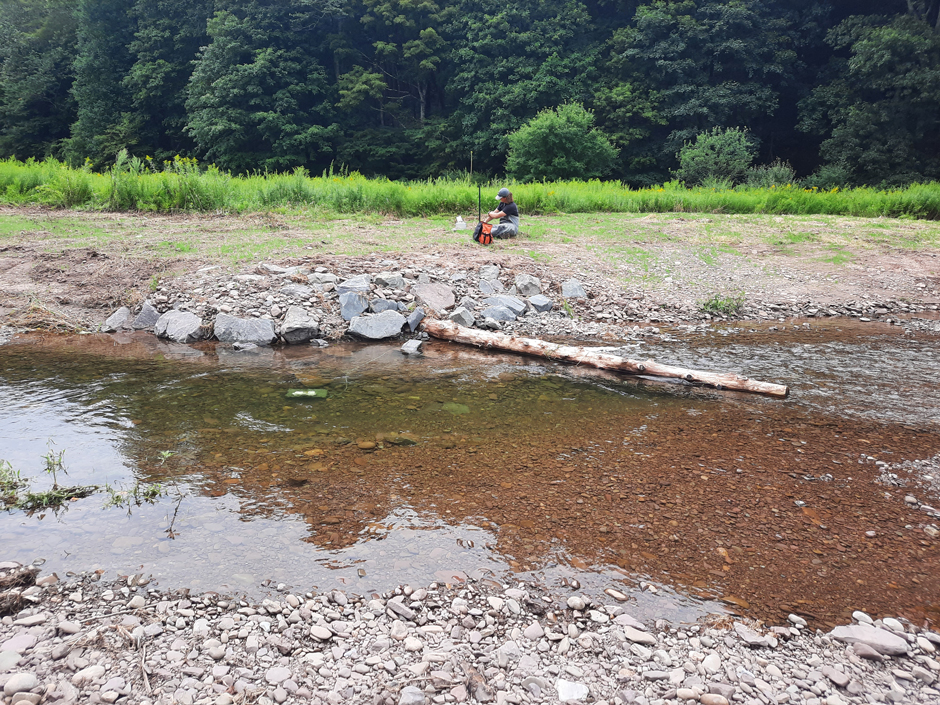
Jared Poole placing an air logger on Plunketts Creek. (Credit: / Susquehanna University)
How Temperature and Depth Measurements Inform Management
First, the project aims to help resource managers set priorities for conservation, based on habitat and network complexity.
Wilson explains that more complex systems, like those that have multiple headwater sources that connect before reaching the mainstem, offer more shelter and refugia for fish if that system is hit by a storm.
In contrast, in less complex systems, like those where a headwater flows right into the mainstem, there aren’t a lot of places for fish to take shelter during large flood events.
Second, was to evaluate the impact of climate change on these watersheds. While Northcentral Pennsylvania is not particularly impacted by the temperature changes often associated with climate change, the region does experience shifts in the severity and frequency of precipitation.
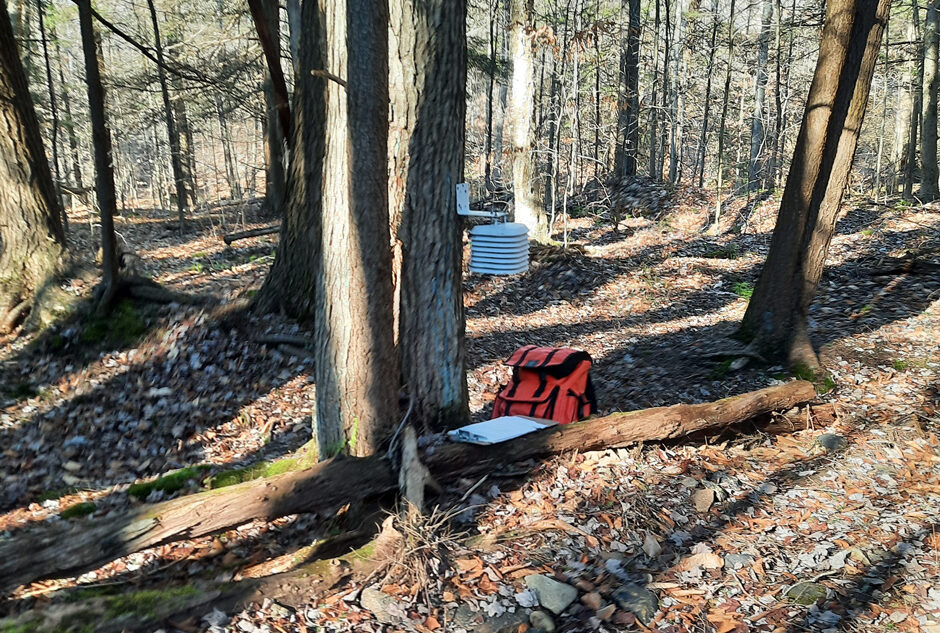
Air logger to measure barometric pressure near multiple stream gages in the Loyalsock watershed. (Credit: Sara Ashcraft / Susquehanna University)
Instead of more frequent, smaller storms, Pennsylvania has experienced an increase in severe storms paired with longer periods of drought in between, which impact stream health and flow on both ends of the extremes.
“You have higher highs during storm events because the ground is probably drier with longer drought periods in between,” explains Wilson. “But you also have lower lows because the groundwater isn’t recharging as much, since most of the water is rushing off during a storm.”
He continues, “If your groundwater is lower, it means you’ve got less groundwater going into the stream—and if you’ve got less groundwater in the stream, then the same air temperature is going to warm the water quicker and higher.”
This relationship between water depth, water temperature, and air temperature is the reason behind Wilson’s selection of the pressure transducers and temperature pendants.
He explains, “One of our primary reasons for putting in the loggers was so that we could compare water depth and water temperature as well as water temperature and air temperature to get at the relative influence of groundwater between our sites.”

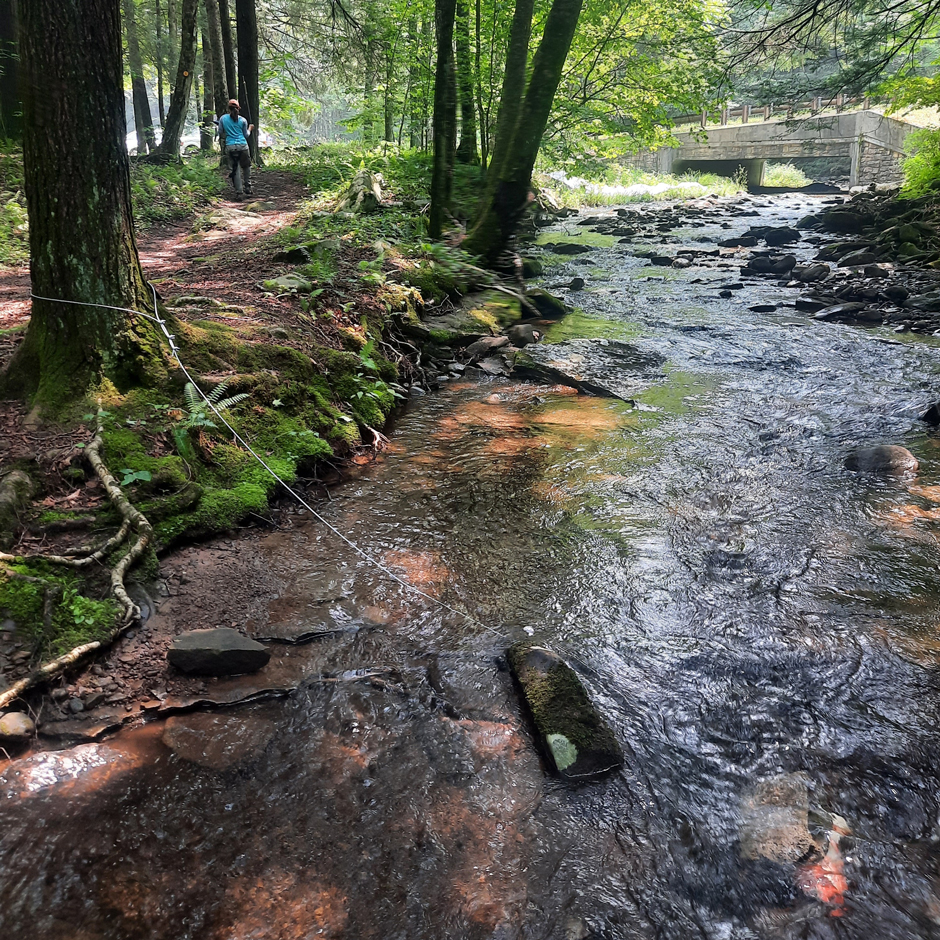
Some loggers get a better view than others in Weed Creek. (Credit: Sara Ashcraft / Susquehanna University)
Perspectives From the Half-Way Point
Data from the loggers are collected every 4-6 months, with the summer collection overlapping with the annual fish assessment, which is on a 3-year rotation between the watersheds.
“The idea is that we get really good coverage across the three watersheds in a long-term scenario. However, it also means that it’s going to be nine years before we can really say anything for sure,” states Wilson.
Officially at the halfway mark, Wilson is optimistic for the nine-year dataset and the possible applications of the data, both in something totally new, like the University’s beaver dam analogs, and adding onto previous findings.
For example, USGS stream gauges in the watersheds revealed that the larger the peak storm of the previous year, the smaller the brook trout population will be the following year.
Temperature data from the loggers have also already been used for brook trout population modeling. The model revealed that the time of year when flow was at its lowest had a strong stabilizing effect on the brook trout population.
“So basically, if your biggest drought is in mid-August, the brook trout do really well. But if your drought is in July or stretches all the way out to late September, early October, the populations do very poorly the next year,” explains Wilson.
While it will be a few more years before the team has a comprehensive dataset for each site, the data is already making a difference.
Cabling to prevent loss during major flooding in Brunnerdale Run. (Credit: Sara Ashcraft / Susquehanna University)


0 comments