Using Buoys to Measure the AMOC: An Ocean Current with Global Climate Consequences
Nicholas Foukal stands on the bridge of a long, pale white boat overlooking the choppy Denmark Strait, the water a greenish-blue hue and dotted with towering icebergs.
The deck and boat interior are loaded with research equipment–several large yellow mooring buoys, a remote underwater vehicle, and a plethora of water quality measurement instruments, just to name a few.
They’re a reminder of what Foukal has come to this formidable ocean passage to do: study the changes befalling the Atlantic Meridional Overturning Current (AMOC), one of the world’s most important ocean current systems.
But as he stares at the massive, rugged snow-capped fjords and glaciers of East Greenland crashing into a seemingly endless turbulent sea, the scale of his task hits him.
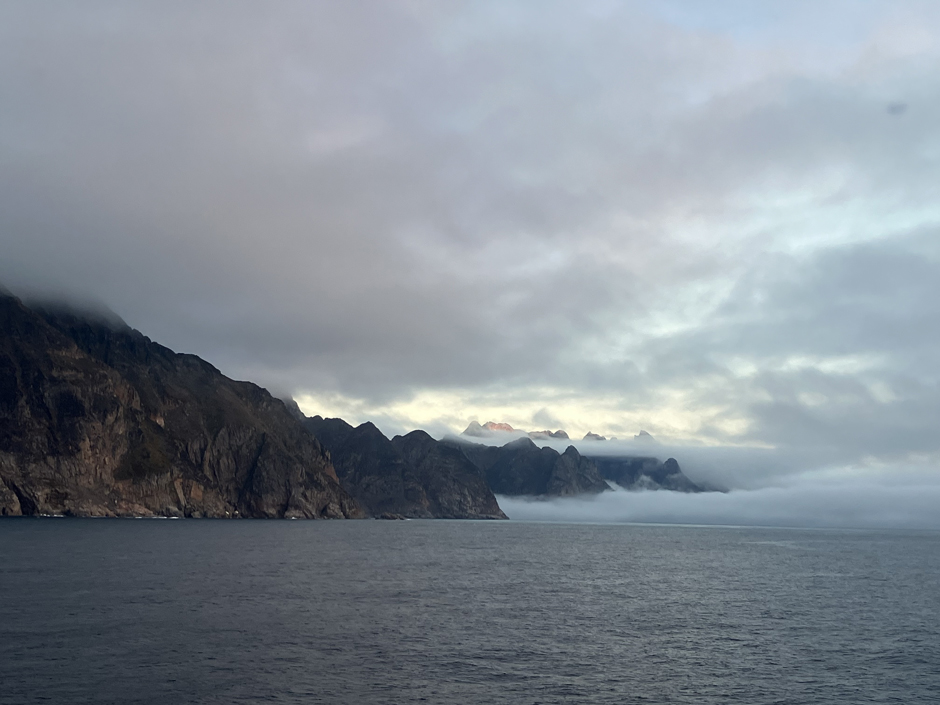
The East Greenland coastline from the site at 71°N where the VBB system was deployed. (Credit: Nicholas Foukal)
Six carefully placed buoys, spanning dozens of miles across the southern edge of one of the harshest seas in the world, will help provide new information on an oceanic current that stretches from pole to pole, impacting the lives of billions of people.
The captain stops the ship at precisely the correct location, even 10 feet makes a difference to Foukal, and his team prepares to drop a buoy into the waves.
Constructed of several small, connected spheres and loaded with sensors to measure water temperature, salinity, and velocity, the buoys will track freshwater melting off Greenland’s plentiful ice sheets.
What Foukal and his team aim to discover is how much freshwater is intruding on the AMOC, and whether those changes represent a climate tipping point with global consequences.
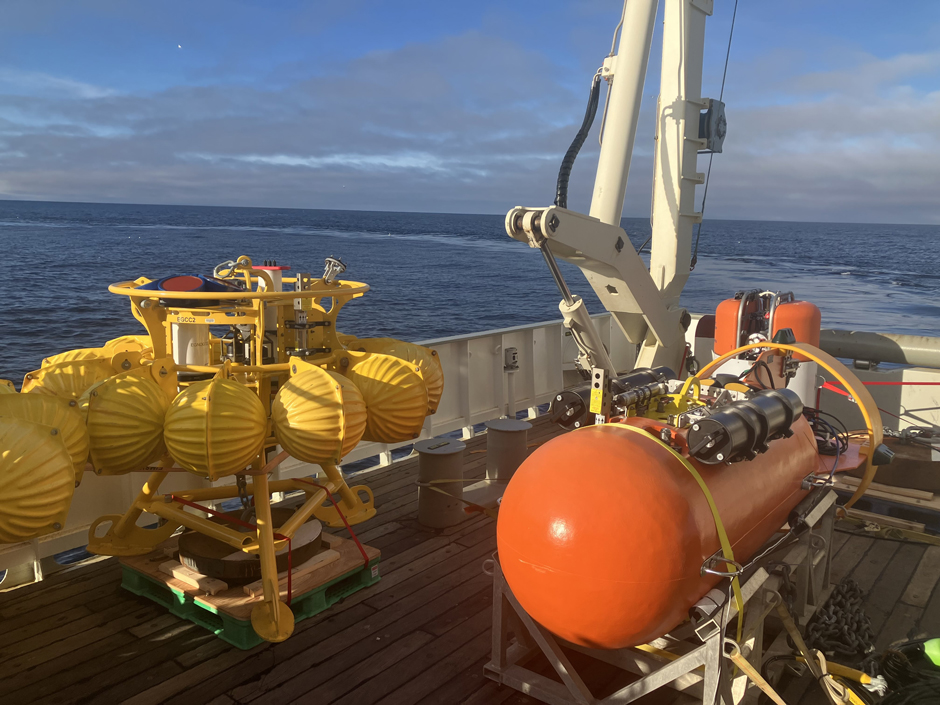
An ocean bottom tripod (yellow, left) and a Stablemoor buoy (red, right). The Stablemoor buoy is a portion of the “Variable Ballast Buoy” system in which an instrument package (not shown) moves vertically depending on how deep the ice is above this Stablemoor buoy. The ice thickness is calculated using the upward-looking ADCP on the Stablemoor. (Credit: Nicholas Foukal)
Why Study the AMOC’s Hydrology?
Dr. Nicholas Foukal is an assistant professor at the University of Georgia’s Skidaway Institute of Oceanography. He studies how the ocean stores and transports heat, which sparked an interest in the AMOC, leading to his current four-year National Science Foundation-funded project.
In the northern hemisphere, this global ocean current transports warmer surface water from the Gulf of Mexico toward northern Europe, before the cold climate around Iceland and Greenland plunges it deeper and turns it around. This deep water then surges south past the US East Coast and toward South America.
“Generally speaking, it’s just this northward flow of surface waters, and then a net southward flow of deeper waters,” Foukal says. “But the really important part is the fact that those two water masses have very different temperatures and salinities.”
It was long thought that these differences remained relatively stable, and the current wasn’t extremely variable. But Foukal says recent research has shown intraseasonal variations in both of these water masses.
The warmer surface current has been measured by the RAPID mooring array since 2004, stretching from Florida to Western Africa.
Further north, the OSNAP array stretches from Canada to Greenland’s southern tip, then toward Scotland. This younger mooring array measures the AMOC, where much of the deep water is formed. Together, data from these arrays have shown that the AMOC.
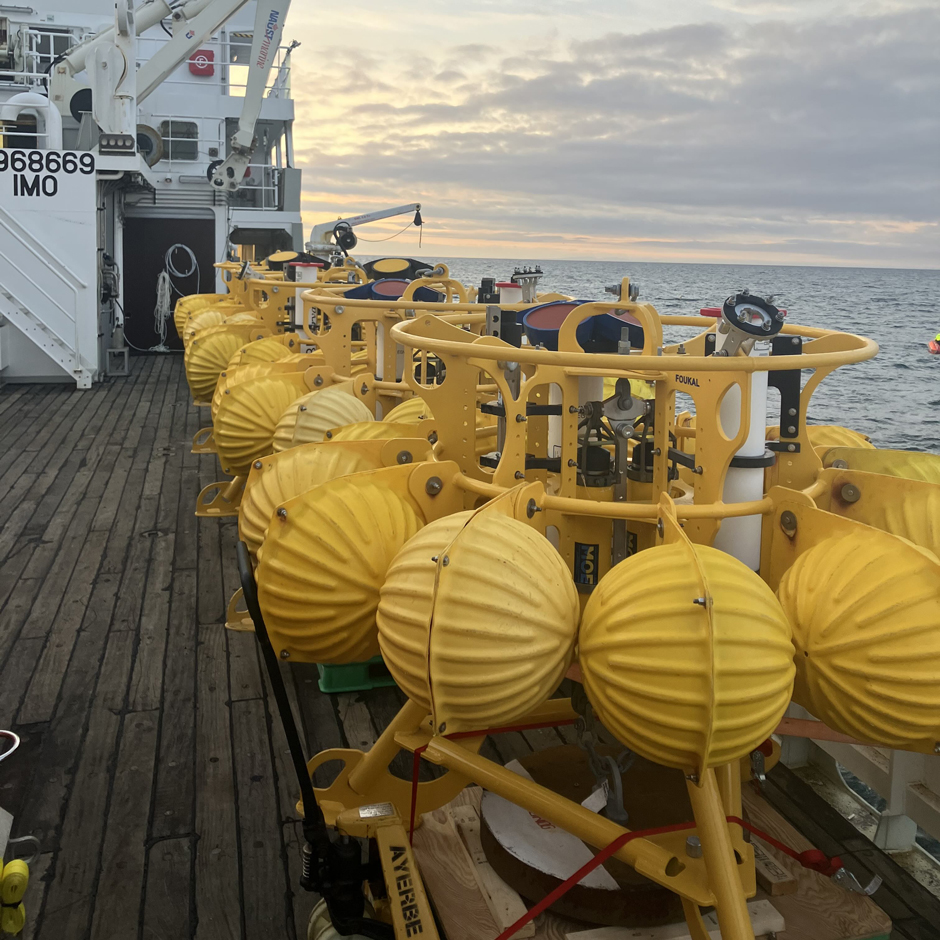
A set of ocean bottom tripods awaits deployment on the back deck of the R/V Þórunn Þórðardóttir (Iceland). Upward-looking ADCPs are visible on each tripod. Yellow spheres provide flotation for mooring recovery when the anchor is released after a year of deployment. (Credit: Nicholas Foukal)
Overall, Foukal says the massive current is becoming weaker and stronger on a more variable time scale. The problem is that no one is confident about what is causing these changes around AMOC’s current northern terminus.
“The question is, ‘what causes the variability in those time series?’” Foukal explains. “And to understand that, you need to look at other things, like a stressor or something that’s a physical force on [the] AMOC.”
This question led to a hypothesis within the scientific community: global warming-induced ice melt is flowing off East Greenland, introducing too much freshwater to the salty ocean current and changing its density.
“Globally, if you look at the density structure, temperature is a much larger control on density than salinity is,” Foukal says, which is why a warm surface water current flows north from the Gulf.
He continues, “But in certain regions, like the polar regions, salinity is more important.”
Freshwater is less dense than saltwater, so some believe that freshwater intrusion is throwing these salty currents off their normal circulation pattern, therefore weakening the southbound deep water formations.
Yet no one has successfully tested this hypothesis and measured how much freshwater is actually flowing into the Denmark Strait, something that astounded Foukal as he researched this project.
“It’s certainly well known that this is a really sensitive component of our climate system, yet no one’s been able to actually measure, not only the variability, but what the mean [of freshwater input] is,” Foukal says.
Months later, as he floats along Greenland’s treacherous east coast and deploys buoys further north than most have ever tried, he understands why. But Foukal knows this data is important, and hopes some intuitive system designs will overcome the harsh Arctic conditions.
The East Greenland coastline near the site where the VBB was deployed at 71°N. (Credit: Nicholas Foukal)
Challenges Deploying Buoys and a Density-Measurement System
The biggest obstacle for Foukal’s team when deploying their buoys is also, quite literally, the biggest obstacle in the strait: massive icebergs.
Large, unpredictable, and capable of stretching deep below the surface, icebergs can wreak havoc on unattended monitoring systems, especially with the parameters his team is measuring.
“Salinity is tricky because you have to have an instrument that’s in the part of the water column where you need that data, and ideally you want the salinity near the surface,” Foukal explains. “The problem is, there’s ice up there, and icebergs tend to just destroy moorings.”
Foukal’s systems include the buoys and their moorings, with a rope system snaking beneath the waves. The rope houses several CTD sensors to measure water salinity and temperature, while an ADCP is attached to the bottom to measure water velocity.
Together, Foukal says this will help them understand how much freshwater is coming off Greenland, and where it’s going.
To hopefully get around the iceberg problem, Foukal explains that the links between his instruments are intentionally weak. That way, if an iceberg comes along and knocks off the top instrument, the rest of the mooring will stay in place and continue logging measurements.
He also partnered with the Woods Hole Oceanographic Institute to deploy a variable ballast buoy for one of his moorings. If this buoy, which was programmed to move within the water column based on the presence of icebergs, is successful, Foukal hopes to see more like it deployed in the future.
Foukal’s six buoys are part of a larger network that stretches even further east into the Denmark Strait toward Iceland. These extra seven buoys, which are from Norway and Germany, will help provide a more complete picture of how the AMOC behaves at such a northerly longitude.
Now that Foukal’s exciting but difficult two-week deployment off Greenland is completed, he must wait. The buoys will be in the water for a year before he removes them and extracts the data.
He’s hopeful that his system will hold up, as even a year’s worth of baseline data about freshwater in the AMOC is crucial for understanding the ocean current’s future.
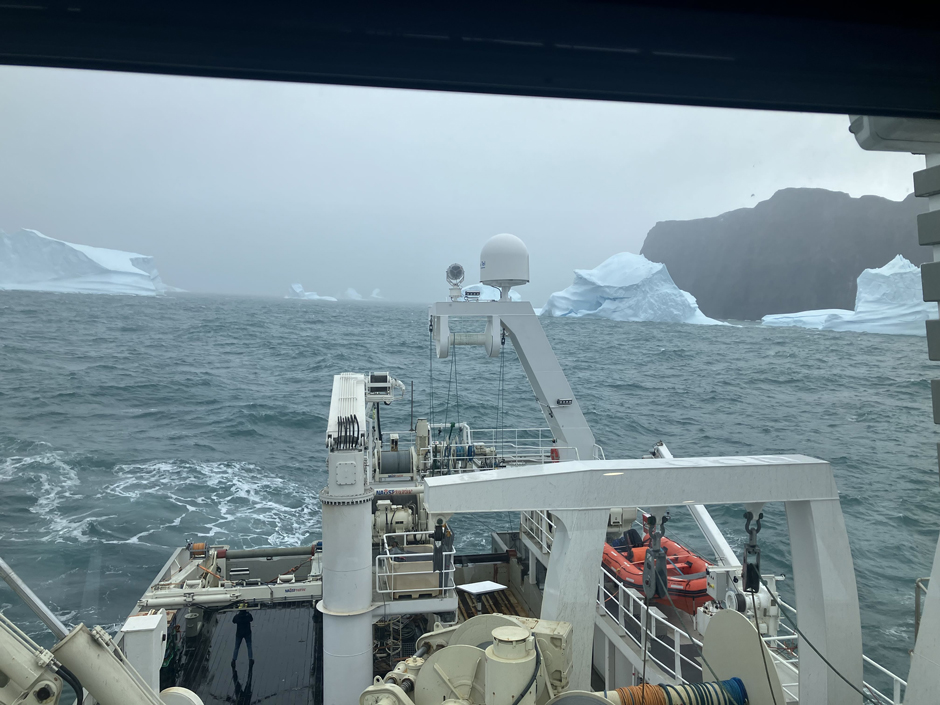
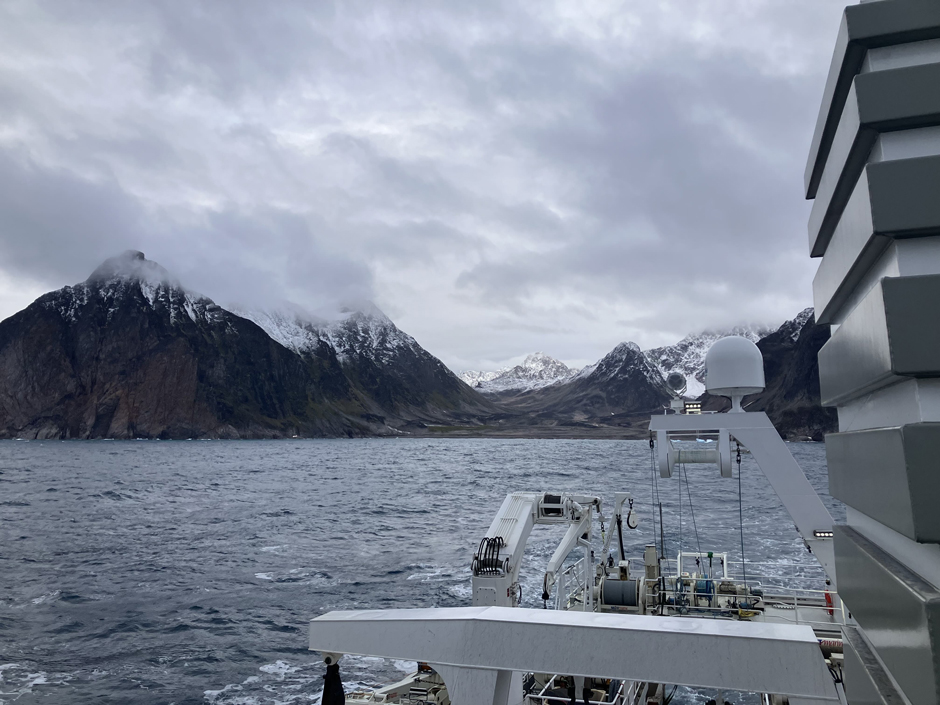
Icebergs choking the exit of Scoresby Sound. (Credit: Nicholas Foukal)
Applying Data From Six Buoys to the Entire Ocean
Ultimately, Foukal hopes that his data can be used to better calibrate the computational models that predict how the AMOC will change. In fact, he’s partnered with a professor at Johns Hopkins University to refine these models.
Without baseline data on the amount of freshwater already in the North Atlantic, these models can’t accurately predict how much is needed to significantly alter the AMOC. And because this current is broadly recognized as not only an important ocean system, but also a potentially dangerous climate tipping point, he knows it’s vital to understand this freshwater input.
So as Foukal looked over the North Atlantic waves while sailing away from a tiny, yellow “pinprick” of a buoy dropped in what looks like an endless ocean, it’s both exciting and nerve-wracking.
He sometimes can’t believe that several small systems among the unfathomably large ocean can truly capture global trends, but he also trusts his team’s work. This is the place to take these globally consequential measurements.
“You have to look for places where there’s either choke points in the circulation […] or where all the circulation condenses into a small area so you can actually measure it,” Foukal explains.
He continues, “Or you need to look for some places where a small geographic area has an outsized role in our climate. And the Northeast Greenland shelf is absolutely that.”
Foukal and his team braved the treacherous conditions to deploy these ocean monitoring systems, and they hope to pull data from them soon.
With the correct instruments, carefully placed locations, and some intuitive system design, they may be on their way to better understand the AMOC and how the global ocean is changing with it.
“I always have to think of myself, ‘how are we actually measuring this whole system with just [several] instruments?’” Foukal says. “It’s kind of mind-boggling to actually do that.”
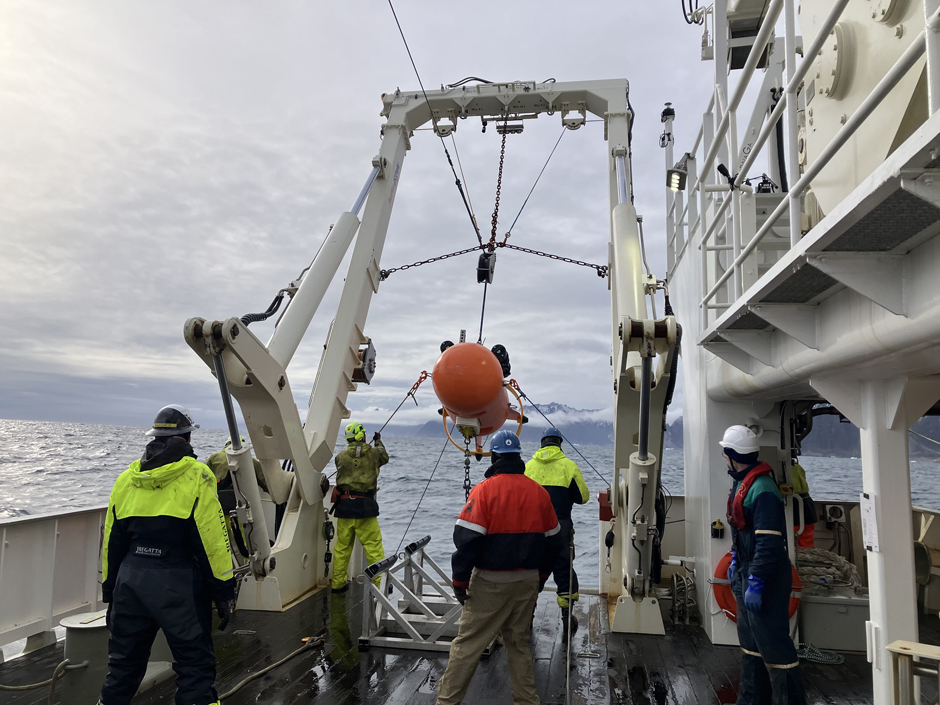
The Stablemoor buoy being deployed by the ship’s crew, and the WHOI Mooring Operations and Engineering group. (Credit: Nicholas Foukal)


0 comments