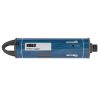
HOBO Conductivity Sensor
Features
- 4-electrode conductivity sensor provides wide measurement range for monitoring freshwater or saltwater
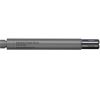
- Conductivity sensor is centrally located to minimize effects from stilling wells or protective guards
- Specially treated stainless steel holds up in saltwater
- Free ground shipping
- Expedited repair and warranty service
- Lifetime technical support
- More
The conductivity sensor is an interchangeable sensor that works with HOBO MX800 Series Water Loggers to measure conductivity and temperature. With this sensor attached to a HOBO MX800 Series Water Logger, the logger can also calculate specific conductance, salinity, and total dissolved solids (TDS).
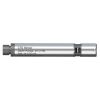
The conductivity sensor can be attached directly to the fully submersible MX801 model, or attached via cable to the direct read MX802 model, which doesn’t require having to pull the sensor out of the water to download data.
| Sensor | |
| Dimensions | 2.5 cm (1 inch) diameter, 15 cm (6 inches) length |
| Weight | Approximately xx g (xx oz) in air; approximately xx g (xx oz) in saltwater |
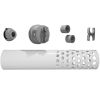
| Wetted Materials | Passivated 316 Stainless steel housing rated for use in saltwater, Viton and Buna-N O-rings, PET sensor connector |
| Conductivity sensor: PET, platinum plating on electrodes | |
| Note: Sensor should be mounted so that it is not in contact with other metals | |
| Environmental Rating | IP68; Waterproof to 100m |
| Conductivity Measurements | |
| Measurement Range | Electrical conductivity and specific conductance: 0 to 100,000 µS/cm |
| Salinity using PSS-78: 2 to 42 PSU | |
| Total Dissolved Solids (TDS): 0 to 100,000 mg/L | |
| Calibration Range | Electrical conductivity: 50 to 80,000 µS/cm |
| 5° to 35°C (41° to 95°F) | |
| Accuracy | Conductivity: +/-2% or 15 µS/cm whichever is greater |
| Salinity: +/-2% of reading or 0.1 PSU, whichever is greater | |
| Resolution | Conductivity:0.1 µS/cm from 0 to 1,000 µS/cm | 1 µS/cm from 1,000 to 10,000 µS/cm |10 µS/cm from 10,000 to 100,000 µS/cm |
| Salinity: 0.01 PSU | |
| TDS: 0.1 mg/L | |
| Response Time | 1 second to 90% at a stable temperature |
| Temperature Measurements | |
| Range | -20° to 50°C (-40° to 122°F), non-freezing water |
| Accuracy | ±0.15°C (±0.27°F) from 0° to 50°C (32° to 122°F) |
| Resolution | 0.01°C at 25°C (0.018°F at 77°F) |
| Response Time | 3 minutes to 90% in water (typical) |
| Drift | <0.1°C (0.18°F) per year |
Select Options


In The News

Wildfire Prevention in the Sierra Nevada Region with the Yuba Watershed Institute
Though recent wildfires have sparked new conversations about wildfire management and response, groups like the Yuba Watershed Institute have been monitoring the forests and water resources of the Sierra Nevada region for decades, managing approximately 5,000 acres of land with the Bureau of Land Management (BLM) and about 7,000 acres in private land partnerships. The goal of the Institute is to work with local communities and land agencies to improve watershed and forestry management through informed practices and public outreach. The goals of the Yuba Watershed Institute are three-fold: Improve the ability of fire suppression agencies like the California Department of Forestry and Fire Protection ( CAL FIRE ) and the US Forest Service.
Read More
Wave Sensors Integration with NexSens Buoys: A Cutting-Edge Solution for Wave Measurment
Real-time wave data supports accurate weather prediction, safe and efficient maritime operations, and provides valuable safety and operating condition information for recreation and commercial fishing. Understanding wave dynamics also helps with the design of protective coastal structures like seawalls, breakwaters, and jetties. It also supports better prediction of their impact on sediment transport and coastal geomorphology. Wave data is a key factor in qualifying and designing offshore wind farms and harnessing kinetic energy for electrical generation. It helps with the understanding of ocean-atmosphere interactions and contributes to studies of sea-level rise and climate change impacts.
Read More
Spring 2025 Environmental Monitor Available Now
In the Spring 2025 edition of the Environmental Monitor, we highlight partnerships across the world and the importance of collaboration between government agencies, universities, environmental groups, local communities, and other stakeholders. From great white shark research in Cape Cod to monitoring fisheries in Lake Erie, this latest edition underscores partnerships that connect stakeholders in a watershed through environmental data. With an emphasis on data sharing, a combination of real-time and discrete sampling keeps the public and partners informed of environmental conditions. Our writers also sought out science professionals dedicated to working with peers within and outside of the environmental sector.
Read More