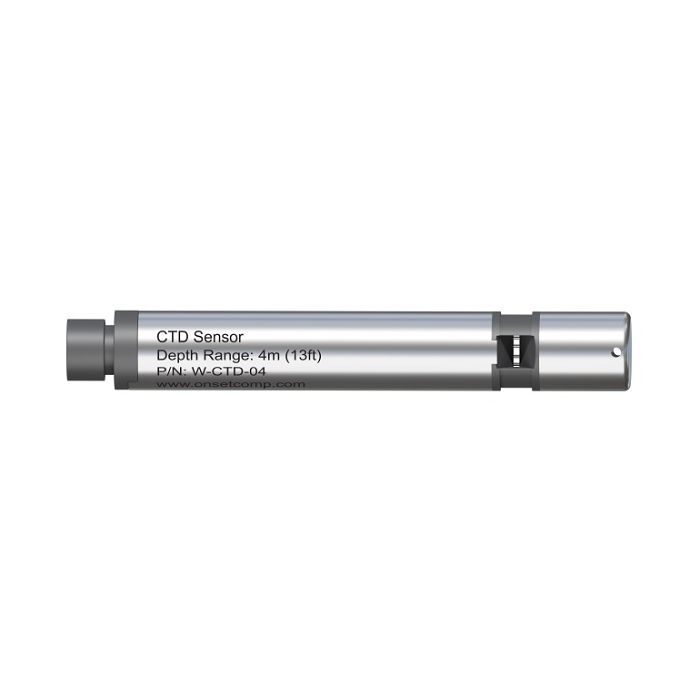
HOBO MX800 CTD Sensors
- Free ground shipping
- Expedited repair and warranty service
- Lifetime technical support
- More
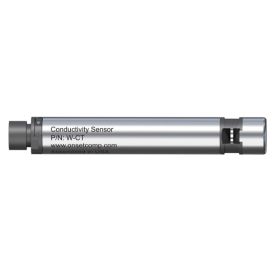
- 4-electrode conductivity sensor provides wide measurement range for monitoring freshwater or saltwater
- Durable ceramic water level sensor, located in the sensor tip for accurate measurement of shallow water levels
- Get water level directly with the MX802, no need for post-processing
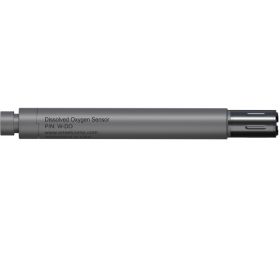
The CTD sensor is an interchangeable sensor that works with HOBO MX800 Series Water Loggers to measure conductivity, temperature, and water level. With this sensor attached to a HOBO MX800 Series Water Logger, the logger can also calculate specific conductance, salinity, and total dissolved solids (TDS).
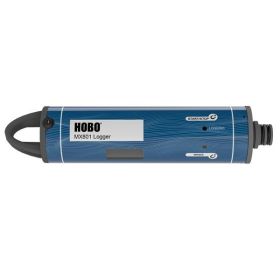
The CTD sensor can be attached directly to the fully submersible MX801 model, or attached via cable to the direct read MX802 model, which doesn’t require having to pull the sensor out of the water to download data.
| Sensor | |
| Dimensions | 2.5 cm (1 inch) diameter, 15 cm (6 inches) length |
| Weight | Approximately xx g (xx oz) in air; approximately xx g (xx oz) in saltwater |
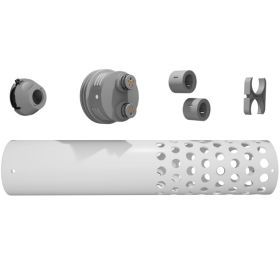
| Wetted Materials | Passivated 316 Stainless steel housing rated for use in saltwater, Viton and Buna-N O-rings, PET sensor connector |
| Conductivity sensor: PET, platinum plating on electrodes | |
| Note: Sensor should be mounted so that it is not in contact with other metals | |
| Environmental Rating | IP68; Waterproof to 100m |
| Conductivity Measurements | |
| Measurement Range | Electrical conductivity and specific conductance: 0 to 100,000 µS/cm |
| Salinity using PSS-78: 2 to 42 PSU | |
| Total Dissolved Solids (TDS): 0 to 100,000 mg/L | |
| Calibration Range | Electrical conductivity: 50 to 80,000 µS/cm |
| 5° to 35°C (41° to 95°F) | |
| Accuracy | Conductivity: +/-2% or 15 µS/cm whichever is greater |
| Salinity: +/-2% of reading or 0.1 PSU, whichever is greater | |
| Resolution | Conductivity:0.1 µS/cm from 0 to 1,000 µS/cm | 1 µS/cm from 1,000 to 10,000 µS/cm |10 µS/cm from 10,000 to 100,000 µS/cm |
| Salinity: 0.01 PSU | |
| TDS: 0.1 mg/L | |
| Response Time | 1 second to 90% at a stable temperature |
| Temperature Measurements | |
| Range | -20° to 50°C (-40° to 122°F), non-freezing water |
| Accuracy | ±0.15°C (±0.27°F) from 0° to 50°C (32° to 122°F) |
| Resolution | 0.01°C at 25°C (0.018°F at 77°F) |
| Response Time | 3 minutes to 90% in water (typical) |
| Drift | <0.1°C (0.18°F) per year |
| Absolute Pressure and Water Level Measurements W-CTD-04 | |
| Range | 0 to 145 kPa (0 to 21 psia); approximately 0 to 4 m (0 to 13 ft) of water depth at sea level, or 0 to 7 m (0 to 23 ft) of water at 3,000 m (10,000 ft) of altitude |
| Factory Calibrated Range | 69 to 145 kPa (10 to 21 psia), 0° to 40°C (32° to 104°F) |
| Burst Pressure | 310 kPa (45 psia) or 18 m (60 ft) depth |
| Water Level Accuracy* | Typical error: ±0.075% FS, 0.3 cm (0.01 ft) water |
| Maximum error: : ±0.15% FS, 0.6 cm (0.02 ft) water | |
| Raw Pressure Accuracy** | ±0.3% FS, 0.43 kPa (0.063 psi) maximum error |
| Resolution | <0.014 kPa (0.002 psi), 0.14 cm (0.005 ft) water |
| Pressure Response Time*** | <1 second to 90% at a stable temperature |
| Absolute Pressure and Water Level Measurements W-CTD-01 | |
| Range | 0 to 207 kPa (0 to 30 psia); approximately 0 to 9 m (0 to 30 ft) of water depth at sea level, or 0 to 12 m (0 to 40 ft) of water at 3,000 m (10,000 ft) of altitude |
| Factory Calibrated Range | 69 to 207 kPa (10 to 30 psia), 0° to 40°C (32° to 104°F) |
| Burst Pressure | 310 kPa (45 psia) or 18 m (60 ft) depth |
| Water Level Accuracy* | Typical error: ±0.05% FS, 0.5 cm (0.015 ft) water |
| Maximum error: ±0.1% FS, 1.0 cm (0.03 ft) water | |
| Raw Pressure Accuracy** | ±0.3% FS, 0.62 kPa (0.09 psi) maximum error |
| Resolution | <0.02 kPa (0.003 psi), 0.21 cm (0.007 ft) water |
| Pressure Response Time*** | <1 second to 90% at a stable temperature |
| Absolute Pressure and Water Level Measurements W-CTD-02 | |
| Range | 0 to 400 kPa (0 to 58 psia); approximately 0 to 30.6 m (0 to 100 ft) of water depth at sea level, or 0 to 33.6 m (0 to 111 ft) of water at 3,000 m (10,000 ft) of altitude |
| Factory Calibrated Range | 69 to 400 kPa (10 to 58 psia), 0° to 40°C (32° to 104°F) |
| Burst Pressure | 500 kPa (72.5 psia) or 40.8 m (134 ft) depth |
| Water Level Accuracy* | Typical error: ±0.05% FS, 1.5 cm (0.05 ft) water |
| Maximum error: ±0.1% FS, 3.0 cm (0.1 ft) water | |
| Raw Pressure Accuracy** | ±0.3% FS, 1.20 kPa (0.17 psi) maximum error |
| Resolution | ±0.3% FS, 1.20 kPa (0.17 psi) maximum error |
| Pressure Response Time*** | <1 second to 90% at a stable temperature |
| Absolute Pressure and Water Level Measurements W-CTD-03 | |
| Range | 0 to 850 kPa (0 to 123.3 psia); approximately 0 to 76.5 m (0 to 251 ft) of water depth at sea level, or 0 to 79.5 m (0 to 262 ft) of water at 3,000 m (10,000 ft) of altitude |
| Factory Calibrated Range | 69 to 850 kPa (10 to 123.3 psia), 0° to 40°C (32° to 104°F) |
| Burst Pressure | 1,200 kPa (174 psia) or 112 m (368 ft) depth |
| Water Level Accuracy* | Typical error: ±0.05% FS, 3.8 cm (0.125 ft) water |
| Maximum error: ±0.1% FS, 7.6 cm (0.25 ft) water | |
| Raw Pressure Accuracy** | ±0.3% FS, 2.55 kPa (0.37 psi) maximum error |
| Resolution | <0.085 kPa (0.012 psi), 0.87 cm (0.028 ft) water |
| Pressure Response Time*** | <1 second to 90% at a stable temperature |
| *Water Level Accuracy: With accurate reference water level measurement, known water density, and a stable temperature environment. System Water Level Accuracy equals the sum of the Barometric Water Level Accuracy plus the selected CTD sensor Water Level Accuracy. | |
| ** Raw Pressure Accuracy: Absolute pressure sensor accuracy includes all sensor drift, temperature, and hysteresis-induced errors. | |
| ***Changes in Temperature: Allow 20 minutes in water to achieve full temperature compensation of the pressure sensor. There can be up to 0.5% of additional error due to rapid temperature changes. | |
- 4-electrode conductivity sensor provides wide measurement range for monitoring freshwater or saltwater
- Durable ceramic water level sensor, located in the sensor tip for accurate measurement of shallow water levels
- Get water level directly with the MX802, no need for post-processing
The CTD sensor is an interchangeable sensor that works with HOBO MX800 Series Water Loggers to measure conductivity, temperature, and water level. With this sensor attached to a HOBO MX800 Series Water Logger, the logger can also calculate specific conductance, salinity, and total dissolved solids (TDS).
The CTD sensor can be attached directly to the fully submersible MX801 model, or attached via cable to the direct read MX802 model, which doesn’t require having to pull the sensor out of the water to download data.
| Sensor | |
| Dimensions | 2.5 cm (1 inch) diameter, 15 cm (6 inches) length |
| Weight | Approximately xx g (xx oz) in air; approximately xx g (xx oz) in saltwater |
| Wetted Materials | Passivated 316 Stainless steel housing rated for use in saltwater, Viton and Buna-N O-rings, PET sensor connector |
| Conductivity sensor: PET, platinum plating on electrodes | |
| Note: Sensor should be mounted so that it is not in contact with other metals | |
| Environmental Rating | IP68; Waterproof to 100m |
| Conductivity Measurements | |
| Measurement Range | Electrical conductivity and specific conductance: 0 to 100,000 µS/cm |
| Salinity using PSS-78: 2 to 42 PSU | |
| Total Dissolved Solids (TDS): 0 to 100,000 mg/L | |
| Calibration Range | Electrical conductivity: 50 to 80,000 µS/cm |
| 5° to 35°C (41° to 95°F) | |
| Accuracy | Conductivity: +/-2% or 15 µS/cm whichever is greater |
| Salinity: +/-2% of reading or 0.1 PSU, whichever is greater | |
| Resolution | Conductivity:0.1 µS/cm from 0 to 1,000 µS/cm | 1 µS/cm from 1,000 to 10,000 µS/cm |10 µS/cm from 10,000 to 100,000 µS/cm |
| Salinity: 0.01 PSU | |
| TDS: 0.1 mg/L | |
| Response Time | 1 second to 90% at a stable temperature |
| Temperature Measurements | |
| Range | -20° to 50°C (-40° to 122°F), non-freezing water |
| Accuracy | ±0.15°C (±0.27°F) from 0° to 50°C (32° to 122°F) |
| Resolution | 0.01°C at 25°C (0.018°F at 77°F) |
| Response Time | 3 minutes to 90% in water (typical) |
| Drift | <0.1°C (0.18°F) per year |
| Absolute Pressure and Water Level Measurements W-CTD-04 | |
| Range | 0 to 145 kPa (0 to 21 psia); approximately 0 to 4 m (0 to 13 ft) of water depth at sea level, or 0 to 7 m (0 to 23 ft) of water at 3,000 m (10,000 ft) of altitude |
| Factory Calibrated Range | 69 to 145 kPa (10 to 21 psia), 0° to 40°C (32° to 104°F) |
| Burst Pressure | 310 kPa (45 psia) or 18 m (60 ft) depth |
| Water Level Accuracy* | Typical error: ±0.075% FS, 0.3 cm (0.01 ft) water |
| Maximum error: : ±0.15% FS, 0.6 cm (0.02 ft) water | |
| Raw Pressure Accuracy** | ±0.3% FS, 0.43 kPa (0.063 psi) maximum error |
| Resolution | <0.014 kPa (0.002 psi), 0.14 cm (0.005 ft) water |
| Pressure Response Time*** | <1 second to 90% at a stable temperature |
| Absolute Pressure and Water Level Measurements W-CTD-01 | |
| Range | 0 to 207 kPa (0 to 30 psia); approximately 0 to 9 m (0 to 30 ft) of water depth at sea level, or 0 to 12 m (0 to 40 ft) of water at 3,000 m (10,000 ft) of altitude |
| Factory Calibrated Range | 69 to 207 kPa (10 to 30 psia), 0° to 40°C (32° to 104°F) |
| Burst Pressure | 310 kPa (45 psia) or 18 m (60 ft) depth |
| Water Level Accuracy* | Typical error: ±0.05% FS, 0.5 cm (0.015 ft) water |
| Maximum error: ±0.1% FS, 1.0 cm (0.03 ft) water | |
| Raw Pressure Accuracy** | ±0.3% FS, 0.62 kPa (0.09 psi) maximum error |
| Resolution | <0.02 kPa (0.003 psi), 0.21 cm (0.007 ft) water |
| Pressure Response Time*** | <1 second to 90% at a stable temperature |
| Absolute Pressure and Water Level Measurements W-CTD-02 | |
| Range | 0 to 400 kPa (0 to 58 psia); approximately 0 to 30.6 m (0 to 100 ft) of water depth at sea level, or 0 to 33.6 m (0 to 111 ft) of water at 3,000 m (10,000 ft) of altitude |
| Factory Calibrated Range | 69 to 400 kPa (10 to 58 psia), 0° to 40°C (32° to 104°F) |
| Burst Pressure | 500 kPa (72.5 psia) or 40.8 m (134 ft) depth |
| Water Level Accuracy* | Typical error: ±0.05% FS, 1.5 cm (0.05 ft) water |
| Maximum error: ±0.1% FS, 3.0 cm (0.1 ft) water | |
| Raw Pressure Accuracy** | ±0.3% FS, 1.20 kPa (0.17 psi) maximum error |
| Resolution | ±0.3% FS, 1.20 kPa (0.17 psi) maximum error |
| Pressure Response Time*** | <1 second to 90% at a stable temperature |
| Absolute Pressure and Water Level Measurements W-CTD-03 | |
| Range | 0 to 850 kPa (0 to 123.3 psia); approximately 0 to 76.5 m (0 to 251 ft) of water depth at sea level, or 0 to 79.5 m (0 to 262 ft) of water at 3,000 m (10,000 ft) of altitude |
| Factory Calibrated Range | 69 to 850 kPa (10 to 123.3 psia), 0° to 40°C (32° to 104°F) |
| Burst Pressure | 1,200 kPa (174 psia) or 112 m (368 ft) depth |
| Water Level Accuracy* | Typical error: ±0.05% FS, 3.8 cm (0.125 ft) water |
| Maximum error: ±0.1% FS, 7.6 cm (0.25 ft) water | |
| Raw Pressure Accuracy** | ±0.3% FS, 2.55 kPa (0.37 psi) maximum error |
| Resolution | <0.085 kPa (0.012 psi), 0.87 cm (0.028 ft) water |
| Pressure Response Time*** | <1 second to 90% at a stable temperature |
| *Water Level Accuracy: With accurate reference water level measurement, known water density, and a stable temperature environment. System Water Level Accuracy equals the sum of the Barometric Water Level Accuracy plus the selected CTD sensor Water Level Accuracy. | |
| ** Raw Pressure Accuracy: Absolute pressure sensor accuracy includes all sensor drift, temperature, and hysteresis-induced errors. | |
| ***Changes in Temperature: Allow 20 minutes in water to achieve full temperature compensation of the pressure sensor. There can be up to 0.5% of additional error due to rapid temperature changes. | |
Select Options


Customer Stories


