

Measuring CDOM
CDOM Measurement Methods
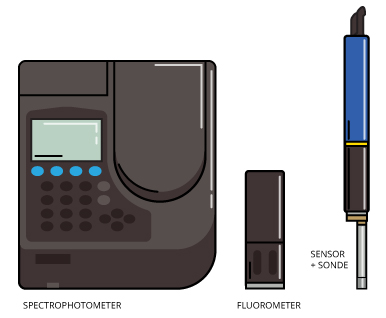
There are two main ways to take a measurement of CDOM. In the first, investigators take water samples and later analyze them using spectrophotometers. Water samples can be gathered in a number of ways, using bottles, grab samplers or even automated sampling machines. Once back in the lab, however, analysis is fairly straightforward with benchtop spectrophotometers. These analyze reflective qualities of water samples to reveal the CDOM they contain.
In the second method, CDOM measurements are gathered in-situ using a fluorometer or water quality sonde with specialized sensor. These can be deployed by hand or as part of a larger, stationary monitoring unit.
When used by hand, sampling is sometimes called “spot sampling,” as the data collected reflect a single moment in time at one location. Gathering CDOM data through continuous sampling as part of a larger monitoring unit is preferred because it can provide long-term data, recorded at project-defined intervals while gathering measurements of other parameters that influence CDOM levels in the water body of interest.
CDOM Sensor Methods
Over the years, many methods were used by scientists trying to measure CDOM in water bodies. In 1949, von Kurt Kalle found that ocean water exhibited a blue fluorescence when it was irradiated by ultraviolet light 1.
In 1981, measurements of CDOM were further advanced by Bricaud 1, who worked with collaborators to measure the spectral values of light by dissolved organic matter in samples that originated from various parts of the ocean. These were each different in terms of pigment and particle content. Using a highly sensitive spectrophotometer, investigators found measurement was possible throughout the visible ultraviolet range (200 to 700 nanometers), even with low concentrations of CDOM encountered in the open sea.
By 1992, Chen used fluorescence to study the benthic fluxes, or the rates of change or movement, of organic compounds 1. Using advanced instruments, Chen took in situ measurements of CDOM in real time in coastal waters, estimated dissolved organic matter (DOM) fluxes and was able to identify sources and sinks of DOM in coastal areas.
From that year and well into the early 2000s, investigators continued to dissect measurements of CDOM, putting a great amount of attention on in situ fluorescence measuring approaches. Many considered the correlation between fluorescence and CDOM absorption at excitation wavelengths, or the relative fluorescence intensity produced by excitation over a spectrum of wavelengths 32, as well as the possibility of measuring the parameter from the sky via airborne planes or satellites in space 31.
As can be seen, methods used to measure CDOM have been developing for decades. Thanks to the testing and tweaking of researchers of the past, those today now enjoy much more advanced means of gathering similar data. The leap to measuring chromophoric dissolved organic matter from the sky has been made, and present-day scientists working in the field can now measure the parameter with handheld meters and sondes, as well as benchtop meters and other instruments.
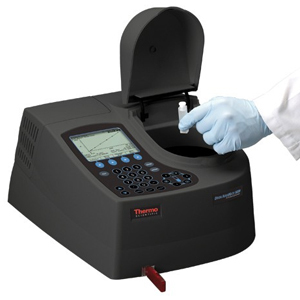
Some of the most common pieces of equipment used to measure CDOM are spectrophotometers. These measure the intensity of light in a part of the spectrum, especially as transmitted or emitted by particular substances.
Spectrophotometers analyze reflective qualities of water samples to reveal the CDOM they contain and are popularly used in water and wastewater laboratories as benchtop meters. These are calibrated using vials of fluid preconfigured to display certain levels of reflectance, but can be custom-programmed.
Present-day spectrophotometers provide excellent detection performance in the full wavelength range of 190 nanometers to 1100 nanometers. Data are typically logged to a USB stick or memory card and transferred to a computer for analysis later.
There are also sensors capable of measuring levels of chromophoric dissolved organic matter directly in the water body of interest. Different options, including submersible fluorometers and sensors connected to water quality sondes, can obtain useful measurements of the parameter.
Fluorometers measure parameters of fluorescence, such as intensity and the distribution of wavelengths of emission spectra following excitation. This is done by sensing probes that plug into a control unit. These identify the presence and amount of specific molecules in water or another medium. Modern fluorometers are capable of detecting CDOM from 0 to 1250 parts per billion.
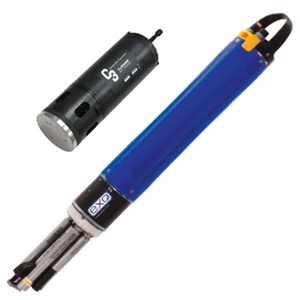
Some multi-parameter water quality sondes can detect CDOM if an appropriate probe is added. Sensing probes that track fluorescent dissolved organic matter are often used with sondes and serve as a surrogate for CDOM.
While spectrophotometers are typically relegated to use within the lab, fluorometers and water quality sondes have the advantage that they can be incorporated into larger data collection systems. Instead of logging data entirely, which is a solid option for some studies, the equipment can be set up along other environmental sensors and connected to data loggers.
This approach can yield much more insight and resolution to data concerning CDOM in a waterway. For example, measurements from a weather station can prove highly valuable for understanding the effects of wind and precipitation on dissolved organic matter movement into a lake.
As with most sensors, those used for measuring CDOM need to be calibrated per manufacturer instructions. Some can be calibrated with a known standard at just one point. For others, the process can be a bit more involved.
A typical calibration for a fluorometer is a two-point run. This first involves using a standard solution with zero relative fluorescence units. After the readings have stabilized and it’s clear that the sensor heads are clear of bubbles, the first point is set. A second solution of known RFU value is then used to set a second point for the calibration. It is also possible to temperature-compensate the calibration for select sensors.
Calibrating an fDOM sensor can be done with Quinine Sulfate units, typically in micrograms per liter, or relative fluorescence units. One-point calibrations are possible, but two-point calibrations, wherein a zero standard serves as the first point and a second standard serves as an upper range, are most common.
Spectrophotometers
Spectrophotometers are important tools for gathering CDOM data. The most common are used in the ultraviolet and visible regions of the spectrum. Let’s consider how they work and the technology they carry inside.
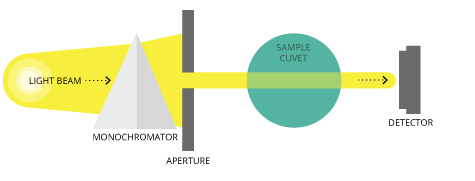
An interior lamp provides a source of light 47. The beam of light strikes a diffraction grating, which works like a prism and separates the light into its component wavelengths. This grating is rotated so that only a specific wavelength of light reaches the exit slit. From there, the light going out interacts with the sample.
From this point, a detector measures the transmittance and absorbance of the sample. Transmittance refers to the amount of light that passes completely through the sample and strikes the detector while absorbance is a measurement of light that the sample absorbs. The detector senses the light being transmitted through the sample and converts this information into a digital reading.
There are two major classes of spectrophotometers: single beam and double beam 48. A single-beam spectrophotometer measures the relative light intensity of the beam before and after a test sample is inserted.
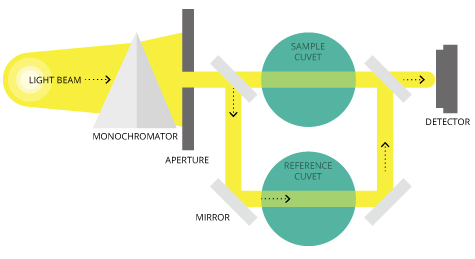
A double-beam spectrophotometer compares the light intensity between two light paths, one path containing a reference sample and the other the test sample.
Although comparison measurements from double-beam instruments are easier and more stable, single-beam instruments have a larger dynamic range and are optically simpler and more compact.
CDOM data from spectrophotometers are typically logged to a USB stick or memory card and transferred to a computer for analysis later.
Fluorometers
Fluorometers can be benchtop devices, standalone units or sensors mounted to water quality sondes. While spectrophotometric measurements are sometimes susceptible to interference because many particles can absorb light, fluorometers are more specific and less prone. This is because fewer things both absorb and emit light.
The inner workings of fluorometers are a little different from that of spectrophotometers. But there are some commonalities, such as lamps and detectors 49.
Typically, fluorometers utilize a double beam. These two beams work in tandem to decrease the noise created from radiant power fluctuations. The upper beam is passed through a filter or monochromator and passes through the sample. The lower beam is passed through an attenuator and adjusted to try and match the fluorescent power given off from the sample.
Light from the fluorescence of the sample and the lower, attenuated beam are detected by separate transducers and converted to an electrical signal that is interpreted by a computer system. Within the machine, the transducer that detects fluorescence created from the upper beam is located a distance away from the sample and at a 90-degree angle from the upper beam. The machine is constructed like this to decrease the amount of stray light from the upper beam that could strike the detector.
A fixed or filter fluorometer uses optical filters to provide specific excitation and emission wavelengths. To measure different substances, most filter fluorometers allow the user to mechanically change to different optical filter configurations. A filter fluorometer is commonly used for quantitative analysis where sensitivity is a major factor.
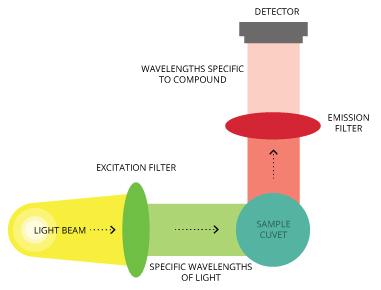
A filter fluorometer works as follows: The light source sends out light in the excitation wavelength range of the compound to be measured. The light passes through an excitation filter, which transmits wavelengths specific to the excitation spectrum of the compound and blocks other wavelengths.
The light then passes through and excites the sample, and the light emitted by the sample passes through the emission filter (which is at a right angle to the exciting light to minimize light scatter). The emission filter further screens the light, the emitted light is measured by the detector and the fluorescence value is recorded by the instrument.
CDOM Remote Sensing Method
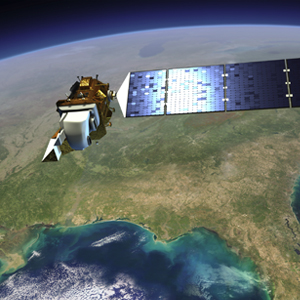
The final step for many scientists around the world is to leverage the power of remote sensing — data collection via satellites — to gather measurements of CDOM. This is because, even though fieldwork can be exciting, remote sensing offers substantial benefits.
One of them is cost. Satellites can gather data at continental scales, which humans can’t hope to match. Along with that, satellites eliminate all of the man hours and staff it takes to collect such troves of data.
Another is accuracy. Though satellite measurements were not as precise decades ago, they have continually been refined. Nowadays, they are far more accurate than they once were, and expeditions are carried out all the time to ground-truth the data they collect and improve their measurements further. Leading agencies in this area include NASA, the European Space Agency and the U.S. Geological Survey, which oversees the Landsat satellites.
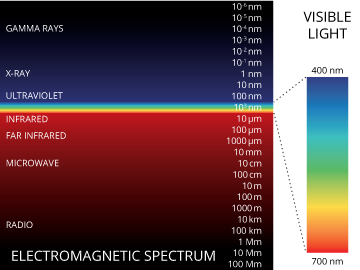
On such satellites, and even on some highly instrumented airplanes, hyperspectral sensors exist that can record wavelengths of light at very fine intervals across the entire electromagnetic spectrum. This covers infrared, visible and ultraviolet light.
In one investigation using data from the Advanced Land Imager, scientists led by those at the University of Uppsala in Sweden used a band-ratio type algorithm to estimate CDOM content in 34 lakes 49. That study, published in 2005, saw high correlation between in-situ CDOM measurements and those taken through remote sensing. Its results support a conclusion that CDOM content in lakes occurring over a wide range of concentrations can successfully be mapped using Advanced Land Imager data.
Another investigation, completed by researchers at the University of Minnesota in 2015, attempted to address several issues with the reliability of remote CDOM measurements 50. These included high variability of CDOM in lakes and rivers at long- and short-term scales, an uncertainty in using levels of colored dissolved organic matter to predict dissolved organic carbon concentrations, and variability of reflectance spectra for waters rich in CDOM, among other dynamics. Researchers noted that different remote sensing algorithms are needed to calculate CDOM levels accurately for waters where colored dissolved organic matter is the only variable affecting reflectance.
Characterizing CDOM
When setting out to characterize CDOM, researchers can focus on one water body or area. They also sometimes sample many different lakes or waterways in a region to see how levels of CDOM in each one compares. Investigations like these aim to answer lingering questions about CDOM in the water of interest, such as its absorption, fluorescence and composition characteristics.
For example, an investigation into the dissolved organic matter characteristics of the medium- and large-sized lakes in the middle reaches of China’s Yangtze River set out to study many waterways 33. The investigation also used several methods, including excitation-emission matrices fluorescence, absorption spectroscopy and a parallel factor analysis model.
Characterizing CDOM in a single water body is simpler because there are fewer complicating factors and water bodies to consider. Still, the size of a lake, pond, stream or river can mean variations in CDOM. There will likely be more fluctuations in CDOM levels the larger the target body of water.
For example, a study considering lakes in Finland relative to their landscape properties 34 found that lake catchments covered more by lake water had lower CDOM concentrations. Lakes that had higher levels of peat covering their catchments, however, had higher concentrations of CDOM.
Units of Measurement
Chromophoric dissolved organic matter is an optical definition for that portion of dissolved organic matter that is able to absorb solar radiation 11. The molecular components, known as chromophores, absorb ultraviolet radiation and conjugation – in chemistry, connecting p-orbitals with delocalized electrons in molecules with alternating single and multiple bonds – of these chromophores results in absorption of solar radiation at greater than 290 nanometers.
There are different ways to measure those dynamics, including through fluorescence, the spectral values of light, in-situ fluorescence with sensors and remotely sensed measurements taken by satellites. In each case, the units of measurement for CDOM can vary, but CDOM is most commonly reported in nanometers.
For measuring the fluorescence of CDOM as it was first measured, the yellow substance in von Kurt Kalle’s samples were analyzed between 380 and 650 nanometers, every 10 nanometers, using a dual-beam spectrophotometer. Bricaud would later follow up on that level of measurement, but achieved analysis between 200 and 700 nanometers using a more sensitive spectrophotometer.
When measuring CDOM remotely, typically using satellites or airborne research planes, researchers have focused on measuring chromophoric dissolved organic matter absorption in the ultraviolet-visible spectral range of 307 to 700 nanometers.
Another unit of measurement for CDOM is the relative fluorescence unit (RFU) 27. It is a unit employing fluorescence detection after quantities of matter have been energized by a laser. Higher levels of fluorescence intensity, typically sorted by a computer program, indicate higher RFU values.
One other unit of measurement of CDOM uses the quinine sulfate dihydrate equivalent. This unit is typically used in calibrating CDOM sensors that track levels in parts per billion 36. Quinine sulfate dihydrate solution is used as a calibrating solution, for example at around 100 parts per billion. Sensors calibrated to the standard can then be said to use “quinine sulfate dihydrate equivalent” units for their data.
Typical Levels of CDOM
In terms of levels of CDOM, what is typical will vary with the type of water body under study. In addition, changes in weather can also influence changes in CDOM concentrations. This is because rain, wind and turbulent waves can easily cause more matter from surrounding areas to wash into aquatic bodies and whip it up once it gets there.
For example, an investigation led by Irish researchers noted prolonged effects of high rainfall events on dissolved organic matter levels and water clarity 38. In addition, they found that the duration of in-lake changes tended to last longer with events driven by weather changes with a longer return period. This meant weather conditions were more severe and less frequent at some study sites.
Authors noted that impacts of the meteorological drivers depended on site-specific factors in some cases. High-frequency data were incredibly valuable in their work, as the measurements showed the capacity for the lakes to absorb changes. Some of those included increases in carbon availability and disturbance and decreases in photosynthetically active radiation that shifted lakes toward heterotrophy.
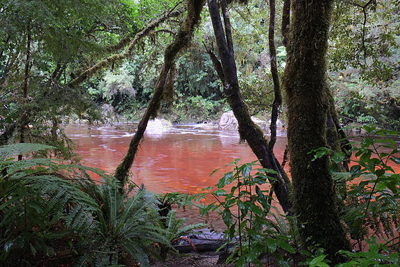
A water body in or near a forest can see elevated levels of CDOM, thanks to the proximity of organic matter and other humic substances. Rain events can wash this matter into the lake, bringing about more CDOM.
Increasing CDOM led to low reflectance, below around 500 nanometers for a group of Minnesota lakes (39), according to NASA research. The best estimate of CDOM, or humic substance, was provided at the ratio of reflectance at 670 nanometers to 571 nanometers. Relationships involving reflectance for lakes in the study were in the range of 400 to 500 nanometers, where CDOM absorbed light.
For wetlands, typical CDOM levels may fluctuate with productivity. In highly productive coastal plains, there can be high levels of organic decomposition 11. In the Chesapeake Bay, both brackish and freshwater tidal wetlands are net sources of CDOM to the estuary 41.
In addition, discharges of freshwater from human sources may cause CDOM levels to be higher in surrounding waterways than in wetlands themselves 40, according to scientists led by the City University of New York studying the Evros River of the eastern Mediterranean. During that investigation, researchers used a dual beam spectrophotometer to measure CDOM absorption coefficients in the range of 270 nanometers to 750 nanometers.
An experiment assessing the production of CDOM in the Arctic Ocean saw that artificially increased CO2 levels had mostly no impact on CDOM concentrations 42. Changes in CDOM absorption spectral slopes indicated that bacteria were most likely responsible for the observed CDOM dynamics. Distinct absorption peaks at around 330 and 360 nanometers were likely associated with mycosporine-like amino acids, researchers found.
The scientists, led by those at the Arctic and Antarctic Research Institute, also showed that a small increase in CDOM during their experiment made it a large contributor to total absorption in a range of photosynthetically active radiation (400 to 700 nanometers). The contribution means that CDOM is important for spectral light availability and photosynthesis.
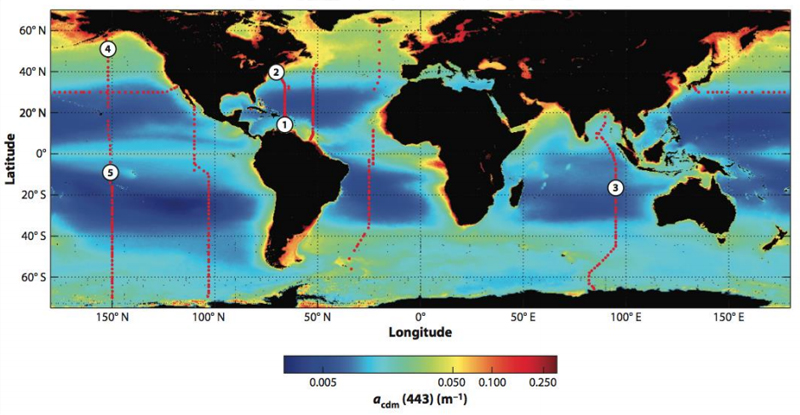
But in the oceans overall, such dynamics are different. In the open ocean, CDOM is almost non-existent. Levels are so low there that satellites barely pick up concentrations 43. Around continental coasts, CDOM is much more prevalent.
In the northern and southern latitudes, CDOM levels are higher than the mid latitudes. Hotspots of CDOM include coastal Asia, Canada, Europe and Russia. Coastal regions off western Africa also have high concentrations of CDOM.
Ocean Versus Freshwater
In freshwater bodies, chromophoric dissolved organic matter is an indicator of a lot of things. There, CDOM can have impacts on salinity. But in the open ocean or in estuaries, higher levels of salinity are found. What effects on CDOM do they have?
In an estuary, behavior of chromophoric dissolved organic matter generally depends on a ratio of the flushing time of the estuary to the timescale of variation in CDOM 48. For a small ratio, variations in CDOM tend to track that of the source waters coming in. But as the estuary struggles to keep up with changes in source waters, a curved, or less linear, relationship can occur.
Terrestrially-derived CDOM is generally more complex than marine CDOM and has a higher average molecular weight and lower spectral slope 4. CDOM chemical structure contains a variety of photoreactive functionalities, quinones, phenols, etc. and depends on origin, light exposure, microbial activity and other factors. CDOM’s structural variability is responsible for the variable nature of CDOM’s optical character and reactivity.
Cite This Work
Fondriest Environmental, Inc. “Measuring CDOM.” Fundamentals of Environmental Measurements. 9 Aug. 2017. Web. < https://www.fondriest.com/environmental-measurements/measurements/measuring-water-quality/measuring-cdom/ >.


