Pushing Lake Science Upstream: Agriculture and Algal Blooms at Lake Erie
Lake Erie is the shallowest, most productive, and most southern of the Laurentian Great Lakes. Each summer, it suffers an algal bloom so large it can be seen from space.
Since the 1960s, excess phosphorus—about 85% from agriculture—has fueled harmful algal blooms (HABs) typically between July and October. These blooms are a known liver toxin and threaten drinking water for over 11 million people. In 2014, one bloom caused an estimated $43 million loss in tourism and recreation.
Ed Verhamme, President of Freeboard Technology (a LimnoTech subsidiary), leads a project managed by the Alliance for the Great Lakes and funded by the Michigan Department of Agriculture and Rural Development (MDARD) and the Erb Family Foundation
Verhamme explains, “The project is deploying hundreds of sensors way up in the watershed in agricultural ditches and streams–the headwaters. That’s where this problem starts, and it’s the accumulation of all of these agricultural practices that ends up contributing to a large load of excess phosphorus and nitrogen to Western Lake Erie, which causes the algal bloom.”
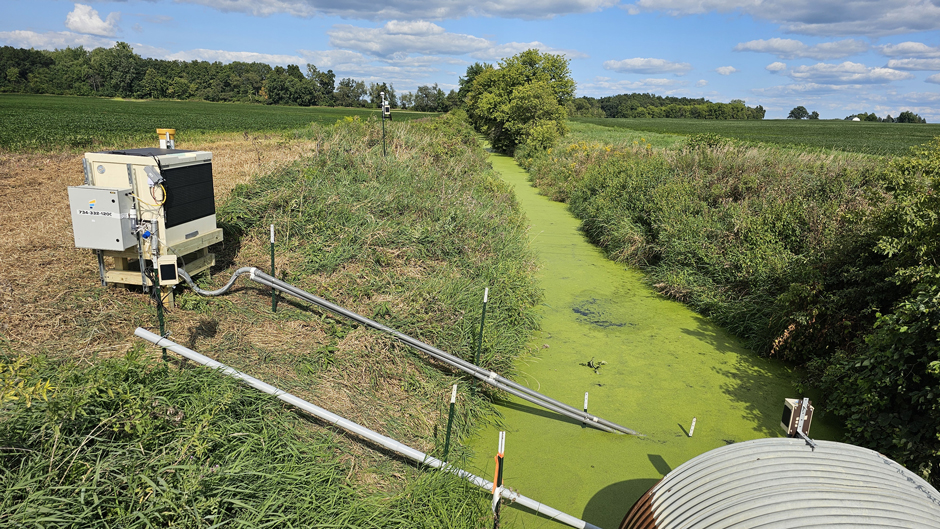
One type of station setup, showing a radar water level sensor, weather station, water sampler, nutrient analyzer, and sondes for temperature, turbidity, conductivity, soil moisture, and rainfall. (Credit: LimnoTech/Freeboard Technology)
Environmental Monitoring of Lake Erie
The State of Michigan has historically partnered with the USGS to maintain five manual monitoring sites across key watersheds.
This showed clear issues with high phosphorus runoff from agricultural land, but as Verhamme explains, “We weren’t quite able to connect the water that runs off the field, that goes in community ditches that farmers share to help get water off the landscape.”
Better data was essential, but scaling the existing system was difficult. Instead, Verhamme says, “This project really took a step back, and selected different technology than [what] the USGS might use.”
Technology has enabled a new possibility–a network of strategically located environmental sensors that provide real-time data on environmental characteristics.
Verhamme says, “The goal is to have live data streams of the stream quality, and feed that real-time data to farmers and to state managers.”
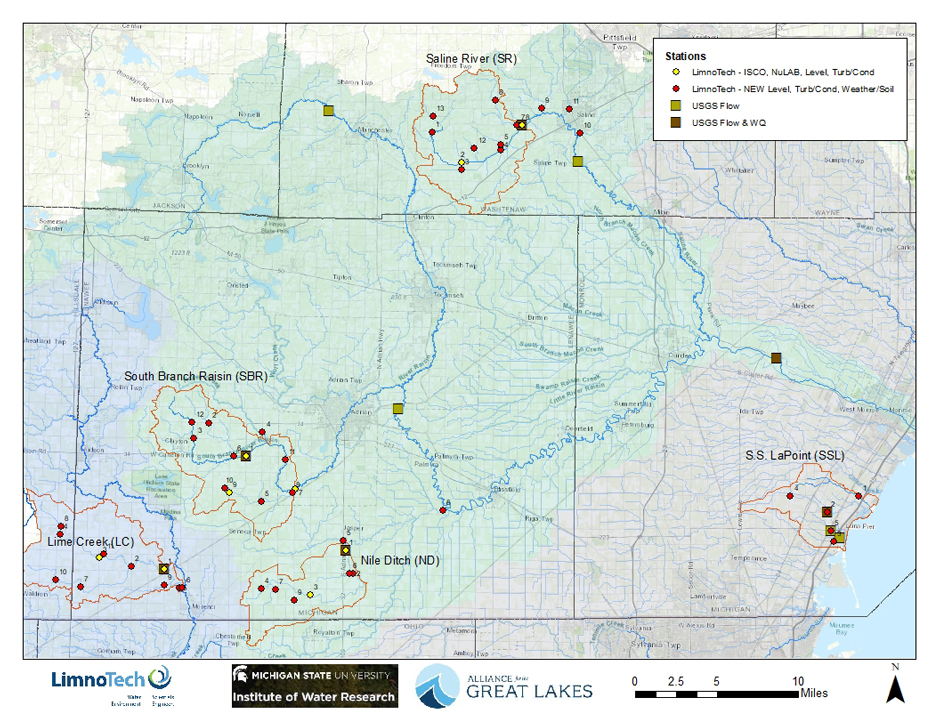
Project map showing the location of measurement stations. The project spans 50 sites, spread across five priority sub-watersheds. (Credit: LimnoTech/Freeboard Technology)
A New Way to Monitor the Environment
The five-year project began in June 2024, with Verhamme’s team working across four counties to install 50 monitoring sites on public rights of way.
“There’s five priority sub-watersheds, and we have 10 stations within each priority watershed.” explains Verhamme. At all 50 sites, water level is measured using sensors like the VEGAPULS C 23 Radar Water Level Sensor, alongside temperature, using a sensor similar to NexSens T-Node FR Thermistor String, turbidity, using a similar sensor as the NexSens NX260 Turbidity Sensor, and conductivity.
At a subset–10 of the 50–rainfall is measured using a tipping bucket similar to the YSI H-3401, soil moisture using a sensor like the Stevens HydraProbe Soil Moisture Sensors, in addition to general weather conditions.
These 10 enhanced sites include autonomous water samplers—remotely triggered to reduce field visits—and online nutrient analyzers that measure dissolved reactive phosphorus every two hours. Five sites measure water velocity using Geolux Non-Contact Flow Sensors.
These 10 enhanced sites include autonomous water samplers—remotely triggered to reduce field visits—and online nutrient analyzers that measure dissolved reactive phosphorus every two hours. Five sites measure water velocity using equipment similar to the Geolux Non-Contact Flow Sensors.
Each site represents data for several square miles, and the sensor density allows the team to track how water moves through the watershed and affects downstream stations.
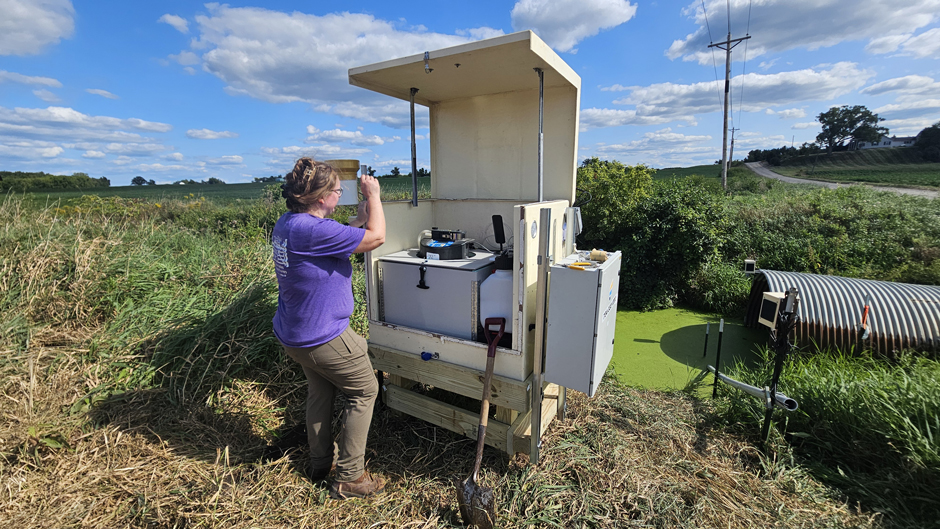
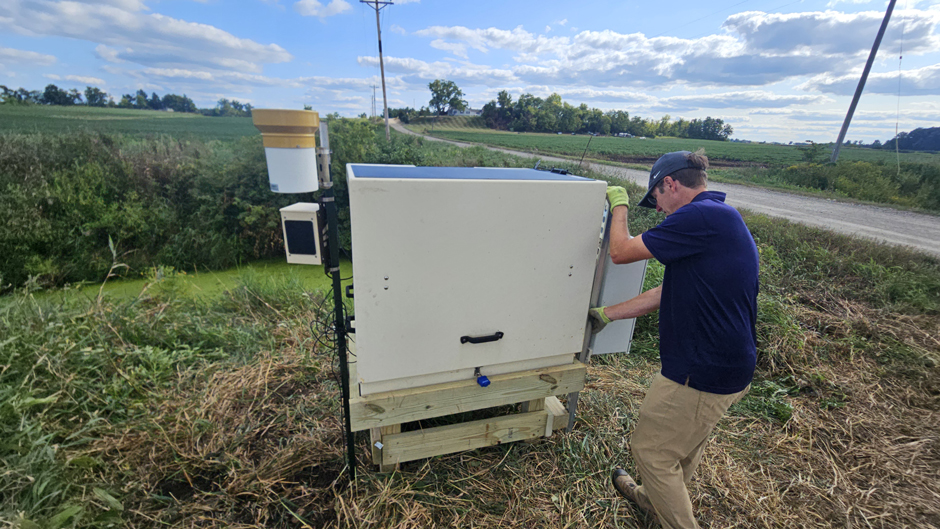
Working in the field remains an important part of the project–after rainfall events, the team goes into the field to collect manual samples. (Credit: LimnoTech/Freeboard Technology)
Deploying a Watershed Sensor Network
Installation faced challenges, especially the “scale and speed” of deployment. Sites were chosen during an “epic drought,” based on where water was expected in wetter periods. Each took about an hour to install, with locations adjusted over the past year after rainfall.
Verhamme recalls, “We were all glued to our computer screens this spring. As every rain event would come through, we’d see 50 stations light up with water level rising fast. We have soil moisture sensors, you could see all that water hitting the landscape and start to make its way down the drainage networks.”
Working in this environment is also new for the team. “There’s lots of challenges with monitoring rural ditches and streams, lots of debris, extremely high turbidites,” he notes. “We get turbidity near 1200 to 1400 [NTU]–most people would call that off the charts.”
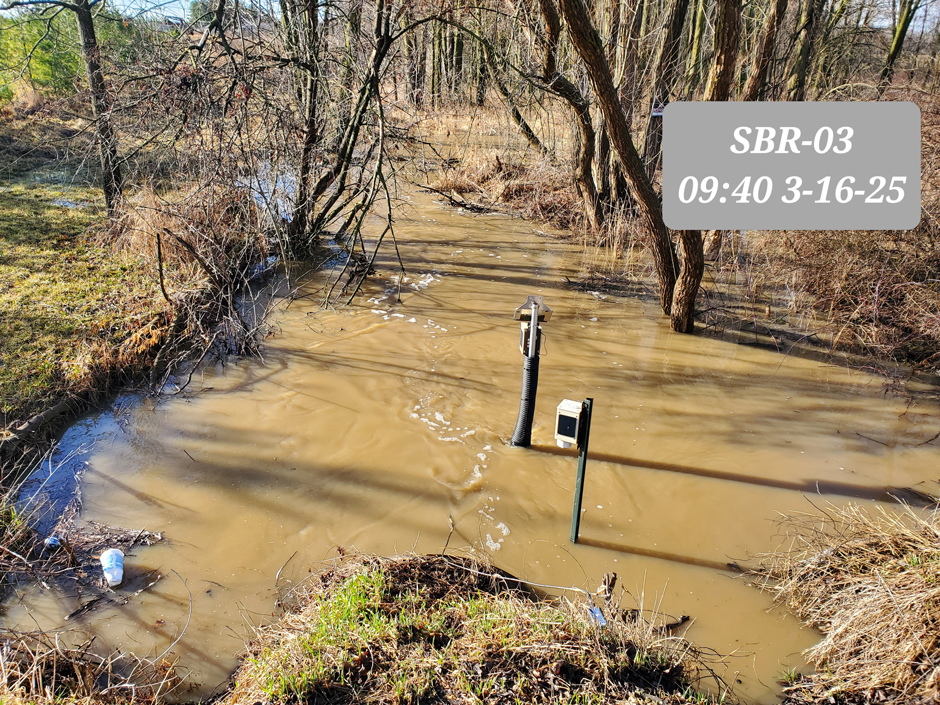
Monitoring rural ditches and streams is challenging, with lots of debris and very high turbidity. (Credit: LimnoTech/Freeboard Technology)
The Benefits of Better Data in the Lake Erie Region
Sensor data has multiple uses. Verhamme uses an IoT dashboard and archives data on an Amazon server, making processing straightforward and cost-effective.
It’s shared with the state to better understand what drives the Lake Erie system. While managing phosphorus load is a key goal, the data also helps improve farming practices.
“Adding phosphorus costs money,” Verhamme notes, so when it ends up in runoff instead of staying in the fields, it’s not just an environmental problem—it’s a financial one too.
High runoff readings may prompt farmers to try alternatives like two-stage ditches, crop rotation, or cover crops. Sensors also track how effective these interventions are.
Some data–like rainfall, water level and soil moisture–is also shared with farmers. “Those are three simple parameters that I know farmers would use regardless of the impact of nutrients on Lake Erie,” says Verhamme.
“Farmers could check their a station that’s maybe a mile from their field, as opposed to the nearest airport, which might only report once a day, or agricultural stations that are maybe dozens or hundreds of miles away,” he adds.
Other metrics like turbidity, conductivity, and phosphorus levels offer further insights. Verhamme’s team works with expert advisers to guide farmers on drainage and water management.
For example, turbidity data after rain can show which areas are prone to erosion and runoff, helping farmers target solutions like planting sacrificial grasses or soil-holding crops.
Installation of sensors happened extremely quickly, and the team often installed entire stations within an hour. Sites were chosen during an “epic drought”, and some have been adjusted since initial installation to account for actual water locations. (Credit: LimnoTech/Freeboard Technology)
An Evolving Approach
This pioneering project offers a forward-looking way of understanding watersheds, and Verhamme emphasises that the approach is evolving.
For example, the most expensive part of the project is trips into the field to collect samples. “How does traditional sampling–which usually involves a person collecting a water sample–blend with technology?” he muses.
For Verhamme, this project “pushes the limits of why we need so many sensors” and shows how “modern sensors can be a lot more efficient, cheaper, and easier to distribute across a larger area.” But for now, it remains an uncommon approach.
Cognizant of its possible replicability after refinement, the team aims to make recommendations by identifying things like what data streams are most useful, how often water samples need to be collected, and how often feedback is given.
Environmental Impact
Verhamme says, “I think this project is really pushing our lake science all the way upstream, right into the neighborhoods where these farmers are working, having discussions about stream water quality, showing data when it’s relevant, but also talking about the difference that farmers can make.”
With four years left and a projected 66 million data points generated during the project lifespan, this pioneering project hopes to unlock the impact of technology, bringing together officials, lake scientists, agricultural scientists, and farmers to work towards a common goal.
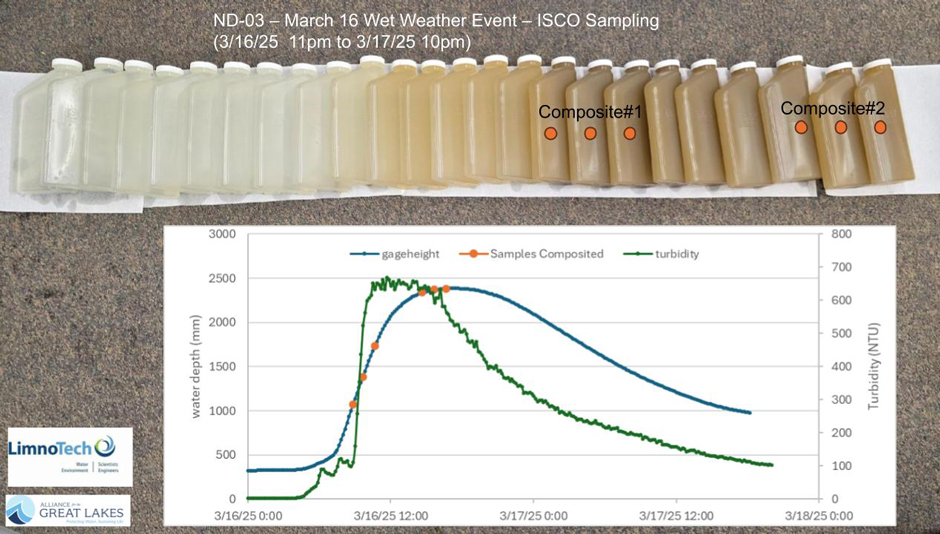
Data from a wet weather event on 16 March 2025, showing water samples, water depth and turbidity. (Credit: LimnoTech/Freeboard Technology)


0 comments