From Hurricanes to Florida’s Red Tides: Monitoring the Southwest Gulf Coast
Nearly every year, southwest Florida is blighted by harmful Karenia brevis blooms–known colloquially as Florida red tides.
These harmful algal blooms (HABs) form over the West Florida shelf and are pushed shorewards by winds and currents. Once in touching distance of the coast, they often intensify, fed by land-based runoff, anthropogenic nutrients, and decomposing marine life killed by toxins produced by these red tides.
Red tides have become more severe and persistent over the past 20 years, causing major environmental and economic damage.
Adam Catasus, Research and Education Coordinator at Vester Field Station for the Water School at Florida Gulf Coast University (FGCU), uses NexSens technology to study HABs across southwest Florida, aiming to improve bloom detection and prediction.

Testing complete, the newest station at the Mound House site is now fully deployed. (Credit: Credit: Adam Catasus)
The Threat of Red Tides
Of the many algae species that cause HABs, K. brevis–responsible for Florida’s red tides–is particularly harmful. It produces brevetoxin, a neurotoxin that affects nerve tissues in both marine life and humans.
These blooms cause massive fish kills, and the release of nutrients from decomposition drives a self-perpetuating cycle of nutrient availability.
In response, southwest Florida counties often issue swim advisories, restrict fishing, and even ban harvesting and consumption of seafood.
Health effects in humans extend beyond direct contamination–airborne toxins have triggered respiratory issues several kilometers inland, and one study reported up to a 3000% spike in healthcare visits during bloom events.
The Goal of HAB Prediction
When Catasus took over the Vester Field Station, its equipment was over 20 years old. With red tides becoming an increasingly pressing issue in southwest Florida, he set out to install a modern monitoring network.
With funding from the Southeast Coastal Ocean Observing Regional Association (SCOORA), Catasus established monitoring stations at two locations, including the Vester Field Station. Now, this has grown to incorporate five real-time monitoring stations.
Each station comprises a NexSens X-Series data logger, solar panel, battery pack, and a YSI EXO2 sonde. These are “fully kitted out” to measure water depth, conductivity, temperature, salinity, dissolved oxygen, turbidity, chlorophyll a, and dissolved organic matter.
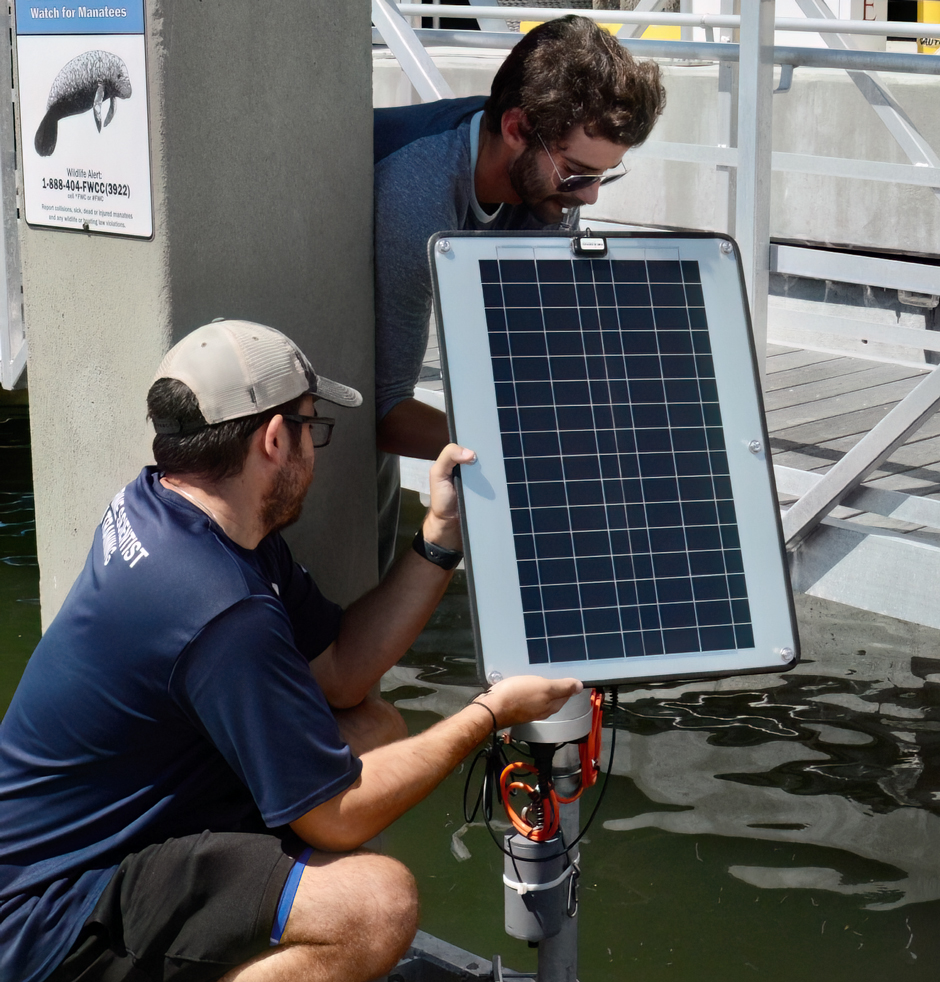
Deploying the NexSens system and equipment at the Gulf Star Marina site. (Credit: Adam Catasus)
Reacting to Data
“The main data that we really want to look at is chlorophyll and dissolved oxygen,” Catasus explains, “Because those are usually good indicators of primary production.”
If a bloom is identified, YSI ProSample P Portable Samplers are swiftly deployed to take physical samples every hour for 24 hours, which are then analyzed for a “whole slew” of parameters.
“What’s nice about the data loggers is that you can set up alerts,” Adam says. A recent Masters student at FGCU worked on setting alarms that triggered “when chlorophyll was high enough to require response”.
However, discerning a true signature from interference caused by biofouling–something the team tackles with regular on-site maintenance and cleaning–and marine critters is not entirely straightforward.
With better data on whether blooms are imminent, forecasting can help improve management and preparation.
For instance, managed discharges from the Caloosahatchee River and Lake Okeechobee in southwest Florida bring nitrogen loads that intensify and prolong blooms. With better forecasting and understanding of the processes driving these blooms, such discharges could be withheld.
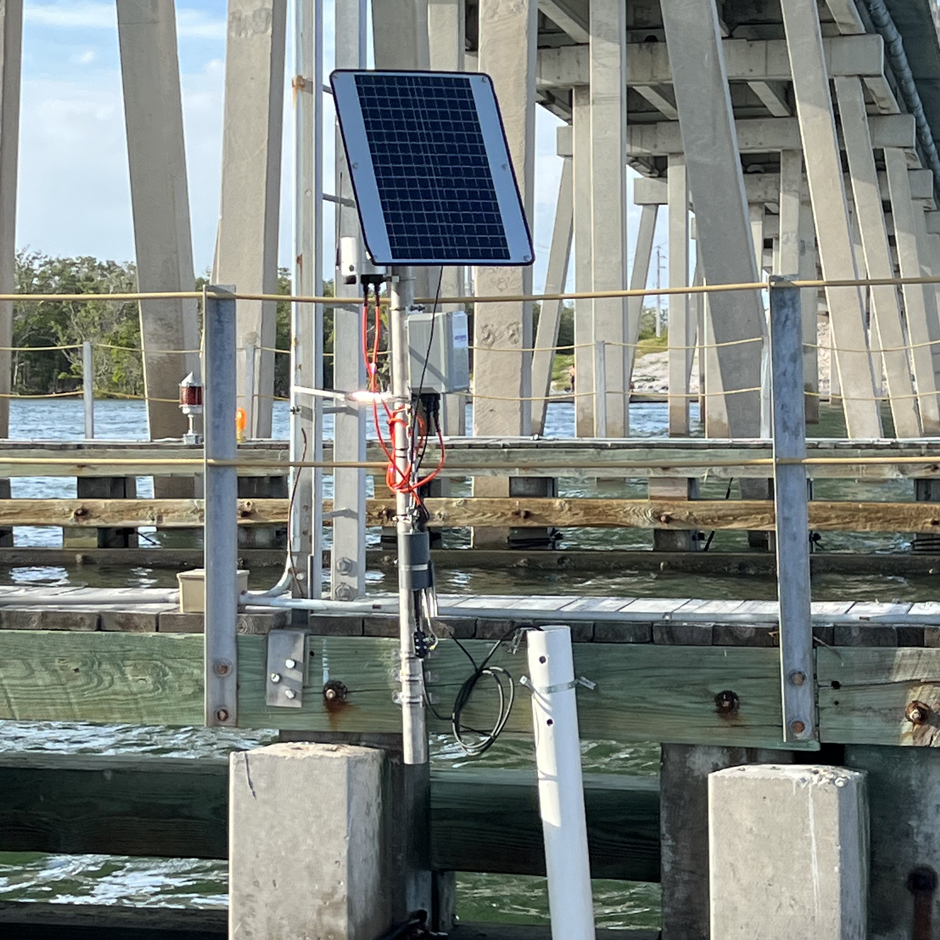
The system deployed at the New Pass site. (Credit: Adam Catasus)
More Uses for Data
With readings taken every 10 minutes, data collected from this network is also used as a teaching resource for FGCU students, with graduates and undergraduates making use of this “giant data set.”
Catasus highlights, “We’ve been getting a lot of our undergraduate and graduate students more familiar working with big data analyses, finding out the best way to make figures and graphical products that can then be used for explaining why this data matters.”
Also under development is a library of preserved phytoplankton that can be shared between research groups in the southeast and the Gulf. Data on which phytoplankton are present at each monitoring station, alongside nutrient concentrations, could give an insight into the factors driving HABs.
Data can also be accessed by the public via the WQ Data LIVE platform.
Catasus explains that this has frequently been used by local news companies for storm surge and flooding reports. “It was pretty cool that our WQ Data LIVE page was live during Hurricane Milton on TV broadcast.”
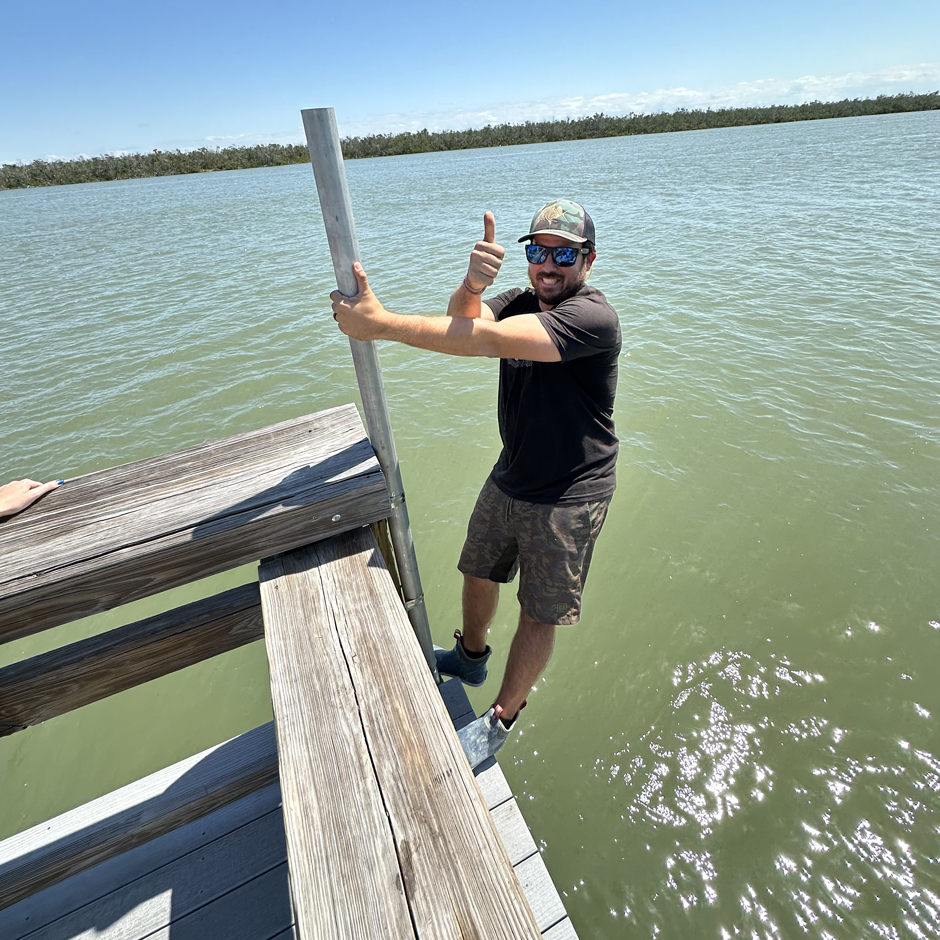
The “mounting strength test.” Catasus uses his body weight to test the strength of deployment materials to ensure systems can remain operational in all conditions, including through hurricanes during the installation of the Mound House site, the newest real-time measurement station. (Credit: Adam Catasus)
Hurricanes
Historic data from hurricanes is hard to come by, but Catasus and his team might be changing that.
“We pride ourselves in building obnoxiously strong systems that can sustain drastic flooding,” Catasus remarks. “They have to survive hurricanes–we don’t take anything out because we want to capture all the data.”
During Hurricane Ian, one system was entirely covered by approximately 4m of floodwater. Even so, “it did not miss a single data point.”
Similarly, during Hurricane Milton, sensors were once again covered by floodwater. Fearing the worst when live data stopped streaming, Catasus hoped it hadn’t been hit by debris and washed away.
Three hours later, though, “it started streaming again […] as soon as the water got low enough, it started streaming. It captured all the data while it was underwater. These things are crazy.”
Data collected during extreme events is being used to support modelling. “Our data was extremely useful for this past hurricane season, looking at the flooding and what’s happening at people’s houses, because a lot of our stations are in areas where a lot of people live,” he explains.
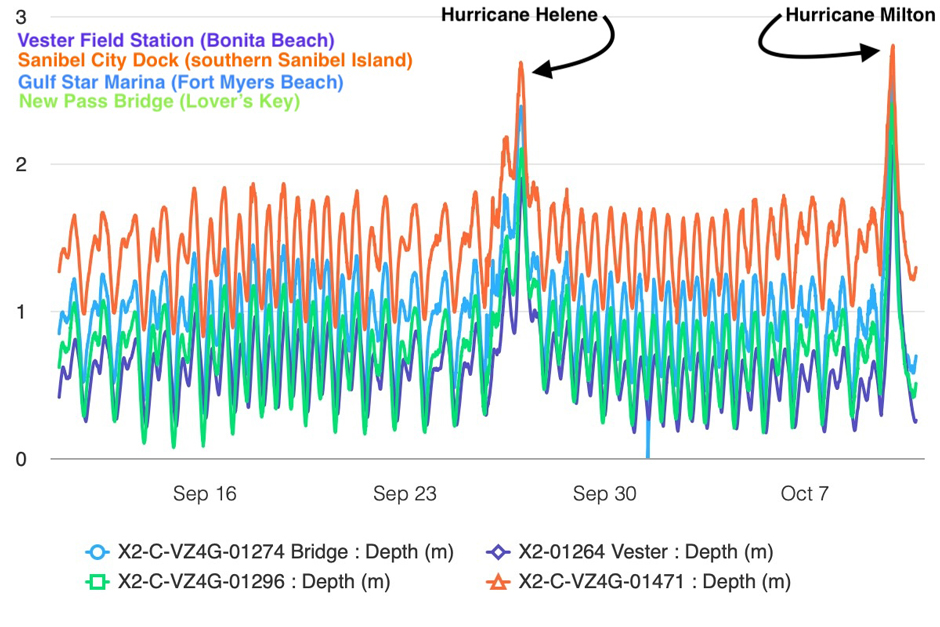
Water depth data from the four stations operational during hurricanes Helene and Milton, which hit Florida within a fortnight of each other, at the end of September 2024. (Credit: Adam Catasus)
The Future
There are plans to add weather stations at all five sites shortly, and ambitions to expand the network to include a sixth, more southerly monitoring station in Collier County.
For Catasus, “the ultimate goal is just to keep these stations going indefinitely. And then slowly expand and build our networks, especially throughout all of southwest Florida.”
The Florida Keys have also been noted as a future location, particularly given recent spinning fish behaviour that has been tentatively linked to HABs.
Catasus also hopes research can “move further offshore” along the shallow West Florida Shelf. By the current hypothesis, this is where Florida red tides begin–their growth jump-started by upwelling of cold, nutrient-rich water from the Gulf basin depths.
Excited about the possible prospects of a buoy network and the data it could provide, Catasus has a number of NexSens buoys that he hopes can be deployed alongside Sofar Spotter Buoys, although he confesses he’s still working through the intricacies of “how to deploy [a buoy] 80-100 miles offshore and make sure it survives major category five hurricanes.”
Supporting Communities
Real-time forecasting of Florida red tides offers major ecological, public health, and economic benefits. However, without timely data, reliable forecasts, and rapid responses—such as shellfish harvest closures or cleanup operations—aren’t possible.
Insights from monitoring K. brevis along Florida’s coast could also help manage HABs elsewhere.
Catasus emphasizes the role of science in supporting communities, “What’s the best way to support our local community? Answering their environmental questions, aligning with their goals, and exploring how technology can help.”


0 comments